Earth Notes: On the JProfiler Java Performance-tuning Tool: Review (2012)
Updated 2022-09-18.Product: JProfiler 7.1
- Brand: ej Technologies
- MPN: JProfiler 7.1
Review summary
- JProfiler 7.1
- Robust intuitive performance-tuning tool, easy to attach to existing systems without fuss. Simple to use, nothing hard to learn over previous versions but better hand-holding and explanation, eg of why some features aren't enabled when doing things a certain way. Tested on x64 Mac OS X.
- Rating: 4.5/5
- Published:
- Updated:
I have also used JProfiler before: ej-technologies has in the past granted me a free licence for JProfiler to work on my pro-bono Java-based multimedia gallery. (And I have such a licence again, having been really pleased with the trial period the offered on the new version, and asked nicely...) I remain earnestly of the opinion that JProfiler is one of the more pleasant tools in this area to work with that I have encountered, and both improvements in the Java platform and JProfiler's polish have helped.
Reflection
With Java's reflection it is possible to build some simple programmatic profiling tools that examine what running threads are up to, and the Gallery automatically accumulates a simple profile of mirrors/nodes/servers that get unexpectedly busy for example, but that takes some effort and requires knowing fairly precisely what you're looking for. The beauty of tools such as JProfiler is the holistic view that they can provide of CPU, memory, threading and similar issues, often ones that you did not know that you had.
Something I keep reminding my clients, given Knuth's dictum:"Premature optimisation is the root of all evil"
is to build a sensible design that is not deliberately profligate or careless with resources, but do not attempt to optimise without finding that there is some performance problem and then use a tool such as JProfiler to know where it actually is, not where you think it might be. That focus of effort on where it will actually pay off is priceless.
For the Gallery, though it may look like it's all about photographs, it actually spends a great deal of its time handling and manipulating text, partly because it's an HTTP/Web based server, and partly because it holds the entire meta-data database in memory for speed, and therefore has to use efficient and complex representations for some parts. Especially since I'm aiming to run on relatively low-powered systems (constrained memory and CPU speed) to keep down carbon footprint, even while running geographically-distributed instances to keep responsiveness good for users worldwide.
Basically I aim to be able to run mirrors on server instances using a few Watts at most, such as the SheevaPlug and maybe even a (B) Raspberry Pi, though the latter will require further tweaking!
The biggest/busiest of my mirrors are multi-core, multi-GB, multi-GHz affairs, and the exact same Java code runs on them, inflating itself to fit!
The two facets that tend to alternate in my attention therefore are memory and CPU efficiency, and JProfiler does a good job with each of those.
Memory
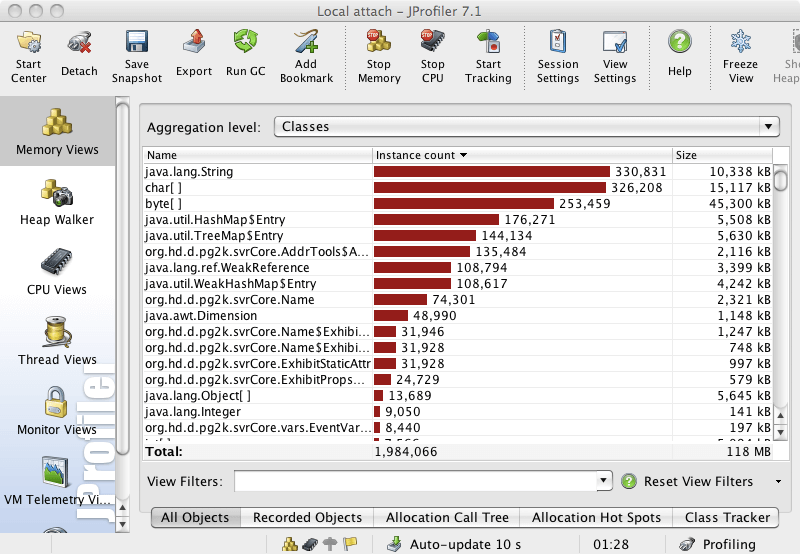
For example, if I run up a mirror of the Gallery in development (it attaches itself to the rest of the system just like a production node, but only I can see its Web interface so only I see how much I borked it), and attach JProfiler to it (without changing start-up scripts for example) I have access to most JProfiler features (other than watching array allocation) and can ask it to start profiling for memory and CPU immediately, the whole effort taking about 30 seconds:
...which tells you straight away that a lot of memory is taken up with text (String and char[]) though in fact after a little while when the system warms up, it holds most text as 7- or 8-bit clean text in byte[] for a 50% space saving, or with various compression schemes, again resulting in byte[], and the String and char[] entries largely go away.
CPU
On the CPU side (and on any system that can 'sleep' well, saving energy, less CPU load corresponds directly to less energy use as well as better speed) I heavily use the "Hot Spots" screen, and here the top items are all to do with text handling again:
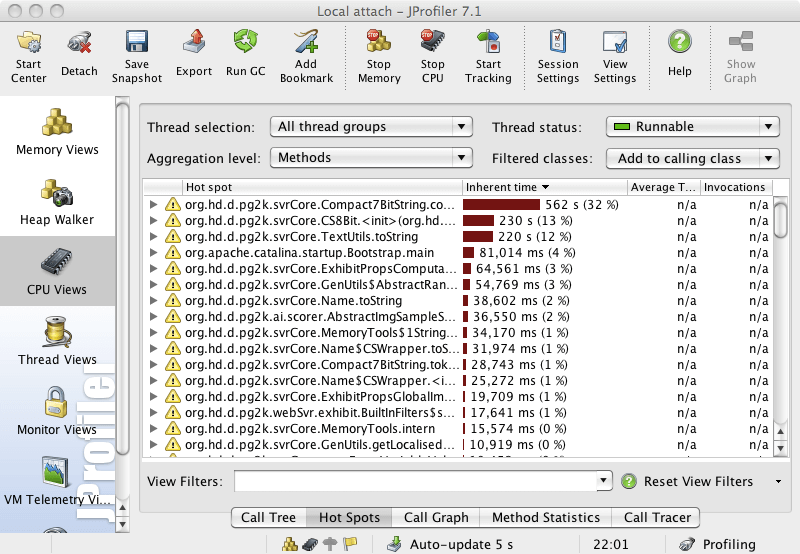
Methods that I was concentrating on tuning last week, from the Name class (another compact representation like a trie), and that were right at the top of the list eating up >10% of CPU, have slipped a long way down out of sight. I may have slowed sea-level rise!
Conclusion
This is not the right site for an in-depth technical exposé, but JProfile does what it says on the tin, reliably and well.