Earth Notes: Saving Electricity and Gas (2020)
Updated 2026-03-29.
data (kWh: e used 2398, e gen -4067, g 2899).
Off-grid 62.6kWh captured by primary (MPPT) solar controller.
See the daily PV generation logs for 2020 as .csv and .png chart.
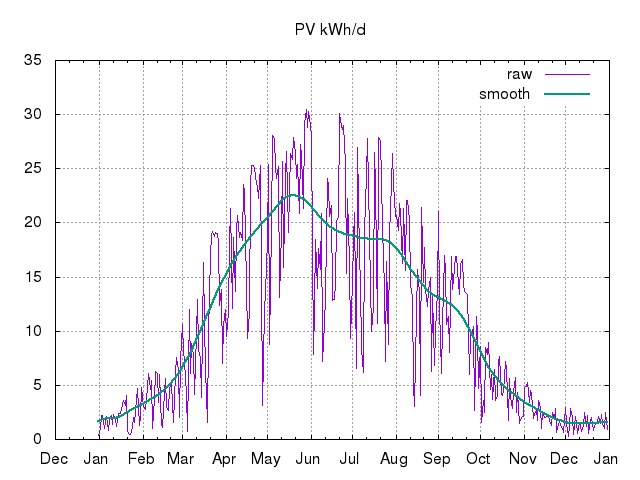

See gas use kWh and heating degree days (HDD) by time for 2020 as .csv and .png chart.

See gas kWh vs heating degree days (HDD) regression for 2020 as .png chart.
See 2012 kWh/HDD estimates plus recent years' estimates from daily Loop data and HDD, with the linear regression fitting in gnuplot itself(!):
| Year | Baseline (kWh/d) | Slope ((kWh/d)/(HDD12/d)) | year kWh | year HDD12 |
|---|---|---|---|---|
| 2007p | 13.84 | 4.09 | ||
| 2008 | 9.32 | 4.14 | 8883 | 1061 |
| 2009 | 6.02 | 3.11 | 6201 | 1068 |
| 2010 | 3.19 | 3.10 | 5784 | 1481 |
| 2011 | 4.08 | 2.87 | 3936 | 820 |
| 2012p | 3.05 | 2.35 | ||
| ... | ||||
| 2016 | 3.9 | 2.4 | 3851 | 990 |
| 2017 | 3.2 | 2.5 | 3423 | 897 |
| 2018 | 3.3 | 2.6 | 3806 | 989 |
| 2019 | 2.7 | 2.3 | 3157 | 913 |
| 2020p | 4.8 | 1.7 | (Note: Jan--Jun data only, lockdown from March, record sunny spring!) | |
Basic heating efficiency (kWh/HDD) has remained fairly stable at ~2.4kW/HDD since the Loop gas meter went in in 2016. Baseline gas consumption, only DHW since May 2013, is hovering around 3kWh/d, according to this computation. Both figures are reasonably true to life, I think, though gas consumption kWh/d data is very noisy for example.
2020 is an odd year starting with record spring sunshine and warmth, then the coronavirus lockdown from March pushing up occupancy and thus likely use of gas (eg for DHW) and electricity (eg for baking, TV and Xbox). As of October, Ecotricity emailed to say that prices are frozen for a year. Each of gas and electricity have a standing charge of a little over £100 per year. The unit (kWh) price is 20.79p for electricity and 4.8825p for gas, a ratio of 4.3:1. Using a heat-pump with a (S)CoP at least this would keep OpEx for space heating and DHW no higher than gas. For space heat this is plausible with a lowish rad flow temperature (eg 35°C), and a ground-source heat pump. For DHW that CoP at (say) 55°C would be hard, but eased if half the DHW was in fact provided by solar PV diversion, ie outside winter months. Our projected annual bills are ~£240 for gas (~3MWh) and ~£270 for electricity (~800kWh). Note that the standing charge is nearly half of each. : Price Freeze
: Loop Gas Monitoring Stopped
The Loop gas monitoring stopped on October 20th, when some works were being done under the kitchen sink. It did not seem to be easily revivable.
Shortly afterwards Loop announced that the entire service was being discontinued. Annoyingly this means that the heating season is missed.
I attempted to restart discussions with Ecotricity to get a smart meter fitted, so long as I could get decent granularity gas readings, but that has not got anywhere. 

: Central Heating
 |  |
The central heating was only switched on 1st December, whereas early November is more typical. HDD 12 for Novembers up to 2020, showing this November to be the warmest for 5 years, but not exceptional:
2007 2008 2009 2010 2011 2012 2013 2014 2015 2016 2017 2018 2019 2020
 134  128   75  179   66  133  139   79   63  154  128  101  141   87
We have subsequently been keeping most of the house on a nominal 17°C (2 on the Radbot dial) which should have reduced demand, though this December is looking to be on the cold side:
2007 2008 2009 2010 2011 2012 2013 2014 2015 2016 2017 2018 2019 2020
 192  233  236  328  154  190  152  183   38  160  187  128  153  186
And here are December gas usage numbers (kWh/HDD),. 16WW was recently partly vacant in 2020 (though I stayed), 2019 and 2017.
2007 2008 2009 2010 2011 2012 2013 2014 2015 2016 2017 2018 2019 2020
52.5 39   34   33   18   22   13   19    9.2 21   20   20   16   17
: Load Profile
For my final statscast for the year, I looked at 16WW's load profile, ie when we demand electricity from the grid, or spill it back.
I looked at a variety of combinations of weekday and weekend and all week, winter and summer, and the difference that PV and a battery makes.
Without PV and battery, the shape of our consumption is probably fairly normal, though we are lowish (efficient) users. But things are different for actual grid imports and exports after PV and battery magic!
 |  |
| CSV | CSV |
 |  |
| CSV | CSV |
| 2020 | Electricity | Gas | |||
|---|---|---|---|---|---|
| Month | Consumed kWh (/d) | Generated -kWh (/d) | Consumed kWh (/d) | Period | Notes |
| 2020-01 | 230 (7.4/d) | -63 (-2.0/d) | 487 (16/d) | 20191231T18:17Z to 20200131T18:15Z (31d) | Meter readings: electricity generation 63.4kWh, export 13.1kWh, import 180.3kWh (thus net consumption (I+G-E) 230.6kWh, self consumption ((N-I)/N) 22%); gas ~43.7m^3 (so 487kWh @ 11.1kWh/m^3). Unusually high electricity consumption possibly in part from extra use of dehumidifier in kids' bedrooms (which could really do with their own MHRV). HDD12=142 vs 218 last January. (Warmest Jan since 2008.) |
| 2020-02 | 197 (6.8/d) | -127 (-4.4/d) | 434 (15/d) | 20200131T18:15Z to 20200229T18:15Z (29d) | Meter readings: electricity generation 129.9kWh, export 49.9kWh, import 120.1kWh (thus net consumption (I+G-E) 197.1kWh, self consumption ((N-I)/N) 39%); gas ~39.1m^3 (so 434kWh @ 11.1kWh/m^3). High electricity consumption possibly in part from extra use of dehumidifier in kids' bedrooms again. HDD12=128 vs 132 last February. (Warmest Feb since 2008 barring 2014.) |
| 2020-03 | 213 (6.9/d) | -337 (-11/d) | 359 (12/d) | 20200229T18:15Z to 20200331T17:50Z (31d) | Meter readings: electricity generation 337.3kWh, export 209.1kWh, import 85.2kWh (thus net consumption (I+G-E) 213.4kWh, self consumption ((N-I)/N) 60%); gas ~32.3m^3 (so 358.52kWh @ 11.1kWh/m^3). Decent sunshine and thus solar gain on some days has reduced space-heat demand. A lockdown for coronavirus started formally on the 23rd, meaning that all four of us are at home all the time other than Jean's lunchtime gig at school, and the odd walk. (Note that we had partial lockdown for a little before that as I was self-isolating and then the family had to stay in for a few days too, as rules changed.) Being at home all day means possibly slightly more able to manually match electrical loads (eg the dishwasher) to PV generation, thus increasing self-consumption a little (53% last March to 60% this). PV generation is up a bit from March last year (9.1kWh/d to 11kWh/d). If the heat battery project had been done, I'd basically expect gas demand to stop until September or later. The Loop electricity monitor seems to have died on the 22nd. HDD12=142 vs 89 last March. |
| 2020-04 | 218 (7.3/d) | -536 (-18/d) | 171 (5.7/d) | 20200331T17:50Z to 20200430T15:22Z (30d) | Meter readings: electricity generation 536.0kWh, export 365.3kWh, import 49.9kWh (thus net consumption (I+G-E) 217.6kWh, self consumption ((N-I)/N) 77%); gas ~15.4m^3 (so 170.61kWh @ 11.1kWh/m^3). Turned central heating off ; house occasionally a bit chilly! Gross consumption of electricity is still on the high side, possibly from everyone being at home, and some extra baking, use of TV and games console and other electronics, etc. Self-consumption is up from 69% to 77%; better manual load-timing opportunities and record sunshine/generation. Record PV generation of 18kWh/d: cf last April's typical 15kWh/d. 17kWh/d has been seen twice in April. (April 2020 provisionally sunniest on record for UK.) Gas is unusually high too, which could just be from extra DHW use. Loop sent a replacement electricity monitor, back in service on 24th. Thanks! HDD12=61 vs 89 last April (yes, same as March!). |
| 2020-05 | 217 (7.0/d) | -743 (-24/d) | 163 (5.2/d) | 20200430T15:22Z to 20200531T17:25Z (31d) | Meter readings: electricity generation 743.2kWh, export 557.1kWh, import 30.7kWh (thus net consumption (I+G-E) 216.8kWh, self consumption ((N-I)/N) 86%); gas ~14.7m^3 (so 163.39kWh @ 11.1kWh/m^3). Gross consumption of electricity is still on the high side, probably from everyone being at home under lockdown as for April. Self-consumption is up from 75% to 86%; better manual load-timing opportunities and record sunshine/generation. Record PV generation of 24kWh/d: cf last May's typical 18kWh/d in line with the original PVGIS prediction. (Historic kWh/d in May up to 2019, max 21: ... 17, 17, 19, 19, 17, 21, 18.) Given that the import supply meter indicates very nearly 1kWh/d, the Enphase may be consistently somewhat overestimating avoided imports. (For example, the import meter shows 31kWh this month, Enphase 16kWh.) This is complicated by the fact that the import and export meters themselves may consume ~1W each or up to 50Wh/d, though I have put the Enphase supply clamp upstream of them to try to cover their consumption too (whether or not ethically I should have to!) so as to minimise all grid flows. This month PV generation passed 33MWh on the first 3/4s of the system, and 10MWh on the remaining 1/4. HDD12=31 vs 39 last May. |
| 2020-06 | 196 (6.5/d) | -576 (-19/d) | 145 (4.8/d) | 20200531T17:25Z to 20200630T16:51Z (30d) | Meter readings: electricity generation 576.2kWh, export 416.4kWh, import 36.0kWh (thus net consumption (I+G-E) 195.8kWh, self consumption ((N-I)/N) 82%); gas ~13.0m^3 (so 144.74kWh @ 11.1kWh/m^3). Gross consumption of electricity and gas are still on the high side, probably from everyone being at home under lockdown as for April and May. Our 'stuck' sunshine weather pattern is gone, so no PV records. HDD12=4 vs 4 last June. |
| 2020-07 | 189 (6.1/d) | -568 (-18/d) | 125 (4.0/d) | 20200630T16:51Z to 20200731T17:42Z (31d) | Meter readings: electricity generation 568.3kWh, export 417.9kWh, import 39.0kWh (thus net consumption (I+G-E) 189.4kWh, self consumption ((N-I)/N) 79%); gas ~11.3m^3 (so 125.43kWh @ 11.1kWh/m^3). HDD12=2 vs 0 last July. |
| 2020-08 | 151 (4.9/d) | -464 (-15/d) | 76 (2.5/d) | 20200731T17:42Z to 20200831T17:19Z (31d) | Meter readings: electricity generation 464.4kWh, export 343.3kWh, import 28.5kWh (thus net consumption (I+G-E) 150.6kWh, self consumption ((N-I)/N) 81%); gas ~6.9m^3 (so 76.48kWh @ 11.1kWh/m^3). Only one week away from home on holiday this August, so dips in daily consumption less dramatic than usual. Residual electricity consumption when away same as last year. (No imports at all while away (<0.1kWh) according to the supply meter.) ~1.8kWh/d of which ~1.1 fridge/freezer, remainder networking (~10W?), security lighting and monitoring/control equipment such as Enphase. HDD12=1 vs 0 last August. |
| 2020-09 | 157 (5.2/d) | -376 (-13/d) | 119 (4.0/d) | 20200831T17:19Z to 20200930T17:16Z (30d) | Meter readings: electricity generation 376.3kWh, export 288.1kWh, import 68.7kWh (thus net consumption (I+G-E) 156.9kWh, self consumption ((N-I)/N) 56%); gas ~10.7m^3 (so 119.21kWh @ 11.1kWh/m^3). This shoulder month would probably benefit from an expanded Enphase battery, increasing self-consumption markedly. HDD12=12 vs 6 last September. |
| 2020-10 | 192 (6.2/d) | -151 (-4.9/d) | 137 (4.4/d) | 20200930T17:16Z to 20201031T18:15Z (31d) | Meter readings: electricity generation 151.0kWh, export 69.5kWh, import 110.9kWh (thus net consumption (I+G-E) 192.4kWh, self consumption ((N-I)/N) 42%); gas ~12.36m^3 (so 137.20kWh @ 11.1kWh/m^3). Daily consumption likely slightly up due to kids at home for half-term break. (The heating is not on yet.) The Loop gas monitoring system that I have been used is being switched off in November. Readings from the 19th (~9am) onwards were partly/fully lost with the sensor having been knocked during works under the kitchen sink (eg to replace our mains water main valve). At the Loop reading was behind the meter by 2.27m^3 (~25kWh). When the rest of the family was away, electricity self-consumption was over 80%. Eg, on the 25th, consumption was 2.6kWh (gen 4.5, imp 0.3, exp 2.0) and 'energy independence' was 89%. On the 26th at sunrise 06:45, it was 07:20 before first (3/4) generation meter light went off indicating net generation, with ~30W generation showing on SunnyBeam. Enphase-reported generation at 07:50 to be 72W. (20201201T08:03Z Sunnybeam showed 17W generation, while Enphase said exactly 0.) HDD12=42 vs 42 last October. |
| 2020-11 | 210 (7.0/d) | -76 (-2.5/d) | 162 (5.4/d) | 20201031T18:15Z to 20201130T17:55Z (30d) | Meter readings: electricity generation 75.6kWh, export 17.9kWh, import 152.0kWh (thus net consumption (I+G-E) 209.7kWh, self consumption ((N-I)/N) 28%); gas ~14.6m^3 (so 162.06kWh @ 11.1kWh/m^3). The heating is not on yet. This has been the warmest November for 5 years. For example on 2020-11-21, with 12°C outside and not windy, it seems to be easy to maintain 4°C to 5°C warmer inside from incidental gains such as from people and appliances. HDD12=87 vs 141 last November. |
| 2020-12 | 195 (6.2/d) | -48 (-1.6/d) | 523 (17/d) | 20201130T17:55Z to 20201231T18:13Z (31d) | Meter readings: electricity generation 48.3kWh, export 8.8kWh, import 155.4kWh (thus net consumption (I+G-E) 194.9kWh, self consumption ((N-I)/N) 20%); gas ~14.6m^3 (so 433.57kWh @ 11.1kWh/m^3). Heating on for start of the 1st. Nominal clock/schedule on 06:30 to 15:59 and 19:00 to 23:45. Radbot has to call for heat also for the boiler to actually fire up. When we use the dehumidifier in the children's bedrooms (or the kitchen) that does provide some visible heating gain. A little heat demand is effectively shifted from gas to the portable heat-pump. When my daughter suddenly demanded heat for her chilly room at about 4:30pm, having not been in for hours and with it ~1°C outside, I actually put the dehumidifier on for her as heating for a while... So that we'd still be warm for seeing in the New Year, I boosted every Radbot at least once from about 9pm. That added just over 1m^3 (~12kWh) of gas demand between my official end of year datum at 18:13 and bedtime at 00:28. (Exactly 2kWh of electricity was used and imported in that time too.) HDD12=186 vs 153 last December. |
| 2020 total (Jan–Dec) | 2398 (6.55/d) | -4067 (-11.1/d) | 2899 (7.92/d) | 20191231T18:17Z to 20201231T18:13Z (366d) | HDD of 838 (vs 913 last year) quite low, eg against 2008 to 2018 mean of 997. Gas consumption lowest since 2015 (then 2862kWh). Coronavirus lockdown for much of this year (basically from March) seems to have pushed up gross electricity consumption N=(Imp+Gen-Exp) by ~20%. Record PV generation (4067kWh, previous record 3988kWh in 2011). Imports are only just over 1000kWh. Self consumption calculated as (N-Imp)/N was 56%. |
| kgCO2 | 857kg (2.3/d) | -1658kg (-4.5/d) | 600kg (1.6/d) | ~-0.17tCO2 [though see below] (~-0.45kgCO2/d) gas/electricity emissions total for 4 people, based on fixed 0.43kgCO2/kWh for electricity (netted) and 0.19kgCO2/kWh for gas, ie slightly carbon negative. We did not fly this year and still do not own a car. With data from the Enphase metering and the FUELINST log I compute a potentially more accurate CO2 electricity balance, noting the relatively low carbon grid intensity when exporting summer PV and high intensity when importing in winter. (There is still the argument that any balancing at the moment is likely done by a gas turbine in practice.) See below for the computations — the estimated figure is now a slightly positive 0.17tCO2 overall for gas and electricity. | |
: ToD Carbon Calculation
Calculating carbon emissions by time-of-day (ToD) involves the FUELINST data from Elexon / National Grid, and the locally sampled 16WW grid import/export flows using the Enphase system.
The actual resolution of the FUELINST data is probably the lowest available with some components delayed up to 30 minutes, though computed values will typically be stored at 5 or 10 minute intervals. The Enphase samples are usually every 5 minutes. Either can be stored more or less often, and duplicates are possible. Data is in datetime order and all timestamps are UTC.
The archived carbon-intensity data looks like:
% xz -d < data/FUELINST/log/2020.log.xz
# Retail GB electricity carbon intensity as computed by earth.org.uk.
# Time gCO2e/kWh
2020-01-01T00:05Z 210
2020-01-01T00:15Z 209
2020-01-01T00:25Z 210
2020-01-01T00:35Z 211
2020-01-01T00:50Z 213
2020-01-01T00:55Z 212
...
That second column is the effective grid carbon intensity for a domestic user, including transmission and distribution losses (currently 7%).
For the Enphase data the key value is the (number that follows) consumption.net.wNow, ie net grid flow.
% xz -d < data/16WWHiRes/Enphase/2020.log.xz
20200101T00:04Z consumption.readingTime 1577837027 consumption.net.wNow 142.092 consumption.total.wNow 138.065 production.wNow -4.027 storage.percentFull 0 storage.wNow -5 storage.readingTime 1577836931
20200101T00:09Z consumption.readingTime 1577837327 consumption.net.wNow 154.046 consumption.total.wNow 151.054 production.wNow -2.991 storage.percentFull 0 storage.wNow -5 storage.readingTime 1577837232
20200101T00:14Z consumption.readingTime 1577837626 consumption.net.wNow 152.356 consumption.total.wNow 149.169 production.wNow -3.186 storage.percentFull 0 storage.wNow -5 storage.readingTime 1577837532
20200101T00:19Z consumption.readingTime 1577837927 consumption.net.wNow 92.774 consumption.total.wNow 89.818 production.wNow -2.956 storage.percentFull 0 storage.wNow -5 storage.readingTime 1577837834
20200101T00:24Z consumption.readingTime 1577838228 consumption.net.wNow 70.484 consumption.total.wNow 67.792 production.wNow -2.692 storage.percentFull 0 storage.wNow -5 storage.readingTime 1577838132
...
(Using these actual relatively-fine-grained grid flows, ie net imports and exports, makes self-consumption disappear, eg at night with no imports when entirely running from battery. But the exports that then don't happen from PV generation become 'lost' negative emissions.)
The simplest approach, assuming no particular sampling bias, is to take the (arithmetic) mean of the pertinent values in each hour. Duplicates by time may possibly be discarded before the mean is taken.
The 1h-bucketed FUELINST values out/yearly/FUELINST-1h-2020.csv.gz are created by script/analytic/FUELINST-bucket-1h.sh. The format (with bucket hour start, in ISO 8601 format) is:
2020-01-01T00:00Z,210.833
2020-01-01T01:00Z,209.167
2020-01-01T02:00Z,206
2020-01-01T03:00Z,200.4
2020-01-01T04:00Z,182
...
2020-12-31T19:00Z,282.667
2020-12-31T20:00Z,269.5
2020-12-31T21:00Z,247.167
2020-12-31T22:00Z,236.4
2020-12-31T23:00Z,223.833
An arithmetic mean of those values indicates an annual mean of 216.365gCO2/kWh.
A sort reveals the range of intensities:
2020-12-18T03:00Z,74.3333
2020-11-12T03:00Z,75
...
2020-09-15T13:00Z,363.5
2020-08-27T11:00Z,364.5
The 1h-bucketed Enphase values out/yearly/Enphase-1h-2020.csv.gz are created by script/analytic/Enphase-bucket-1h.sh. The format (with bucket hour start, in ISO 8601 format) is:
2020-01-01T00:00Z,106.954
2020-01-01T01:00Z,72.0906
2020-01-01T02:00Z,77.9957
2020-01-01T03:00Z,81.7087
2020-01-01T04:00Z,71.7366
Note that neither generated file has entries for every one of the 8784 hours in the 2020 leap year, because machines and networks are down sometimes:
% gzip -d < out/yearly/Enphase-1h-2020.csv.gz | wc -l
8775
% gzip -d < out/yearly/FUELINST-1h-2020.csv.gz | wc -l
8745
The intersection of the two data sources is 8732 hours, ie 8732/8784 = 99.4% of all hours. It is probably reasonable to compute the carbon for the hours that are there, and scale up for the missing hours. Again. assuming no particular bias in the 'missing' hours. Note however, that some problems such as networking issues, may be left unresolved longer at night, when there is lower consumption, so a simple scale up may be on the conservative side, overestimating emissions.
% awk -F, '{print $1}' < Enphase-1h-2020.csv > E.dates
% awk -F, '{print $1}' < FUELINST-1h-2020.csv > F.dates
% wc -l E.dates F.dates
    8775 E.dates
    8745 F.dates
% comm -12 E.dates F.dates | wc -l
    8732
There are 56 hours that are in one data set but not the other:
% comm -3 ~/tmp/E.dates ~/tmp/F.dates | wc -l
    56
% comm -3 ~/tmp/E.dates ~/tmp/F.dates
2020-01-30T12:00Z
2020-02-13T11:00Z
2020-03-03T01:00Z
2020-03-03T02:00Z
2020-03-03T03:00Z
2020-03-05T20:00Z
2020-03-06T07:00Z
2020-03-06T08:00Z
        2020-03-24T13:00Z
        2020-03-24T14:00Z
2020-03-25T06:00Z
2020-04-30T10:00Z
2020-04-30T11:00Z
        2020-05-20T16:00Z
2020-05-28T18:00Z
2020-05-28T19:00Z
2020-05-28T20:00Z
2020-05-28T21:00Z
2020-05-28T22:00Z
2020-05-28T23:00Z
2020-05-29T00:00Z
2020-05-29T01:00Z
2020-07-13T23:00Z
2020-07-14T00:00Z
2020-07-14T01:00Z
2020-07-14T02:00Z
        2020-07-29T18:00Z
2020-08-06T10:00Z
        2020-08-18T17:00Z
2020-09-30T18:00Z
2020-09-30T19:00Z
2020-09-30T20:00Z
2020-09-30T21:00Z
2020-09-30T22:00Z
2020-09-30T23:00Z
2020-10-01T00:00Z
2020-10-15T23:00Z
        2020-10-21T15:00Z
2020-10-26T03:00Z
        2020-10-26T14:00Z
        2020-10-26T15:00Z
2020-10-26T19:00Z
2020-10-26T23:00Z
        2020-10-29T13:00Z
        2020-10-29T14:00Z
        2020-10-30T08:00Z
2020-11-10T08:00Z
2020-11-19T11:00Z
2020-11-19T12:00Z
2020-11-19T13:00Z
2020-11-27T16:00Z
2020-11-27T17:00Z
2020-12-03T19:00Z
        2020-12-14T20:00Z
        2020-12-14T22:00Z
2020-12-18T16:00Z
To join the hours that are present in both (confirming the same number of matched hours in the first instance):
% join -t, -j1 Enphase-1h-2020.csv FUELINST-1h-2020.csv | wc -l
    8732
% join -t, -j1 Enphase-1h-2020.csv FUELINST-1h-2020.csv | head
2020-01-01T00:00Z,106.954,210.833
2020-01-01T01:00Z,72.0906,209.167
2020-01-01T02:00Z,77.9957,206
2020-01-01T03:00Z,81.7087,200.4
2020-01-01T04:00Z,71.7366,182
2020-01-01T05:00Z,67.4731,180.333
2020-01-01T06:00Z,195.651,197.167
2020-01-01T07:00Z,162.984,205
2020-01-01T08:00Z,458.225,218.667
2020-01-01T09:00Z,293.469,240
(The join result is captured: out/yearly/Enphase-join-FUELINST-1h-2020.csv.gz.)
To compute the balance in kgCO2 for the year, between import and export (noting a scale down by 1000x1000 to allow for inputs being in Wh and g/kWh):
% join -t, -j1 ~/tmp/Enphase-1h-2020.csv ~/tmp/FUELINST-1h-2020.csv | \
      awk -F, '{sum += $2*$3} END {print sum/1000000}'
-374.478
Scaling up for the missing hours gives -377kgCO2.
This is less favourable (as expected) than the flat-rate 0.43kgCO2/kWh estimate of -717kgCO2 balance for electricity generation and consumption.
Given the 550kgCO2 emissions from burning gas, that gives a new overall balance for the house for electricity and gas of 173kgCO2, ie no longer negative.
A crude by-hour graph of imports and emissions (which can go negative) can be prepared with:
gnuplot -e "title='2020 CO2 emissions kg/h'" -e "infilename='Enphase-join-FUELINST-1h-2020.csv'" graphing/storesim/CO2-profile-1.txt

Net Negative Bills
Bills for energy from Ecotricity totalled about £500, while FiT payments totalled about £990, for a net negative bill of about £490.