Earth Notes: Statscast - Lockdown Changes, Log Noises (2020-05)
Updated 2025-09-25.Statscast
Hi, I'm Damon Hart-Davis, and welcome to Earth Notes podcast on all things eco and green and efficient @Home!
, for 's stats.
Turn-of-the-month update of home energy and related stats, and playing with May's data for 16WW (ie EOU Towers). Also other significant UK numbers over the month-ish.
First, a mystery noise: [ ... ] No, not a rainstorm nor sizzling bacon — more later...
We've had clean air, blue skies and record sunshine (though more likely driven by climate change acting on the jet stream than lockdown reducing pollution, it seems), and a lot more video calls for work and school and "virtual pub".
There have been changes (including signs of a rebound starting) in water use (the morning peak is later), Internet use, reshaped and reduced GB electricity demand, changed GB electricity generation especially renewables and coal even at home (record May PV generation here by ~15%, and low imports to boot), and mobility (London having rebounded from ~8% of 'usual' at the start of April to ~20% at the start of June).
Given that much retail is restarting in the UK, it seems worth turning some EOU ad slots back on.
[01:46]16WW stats
Given all the warm weather it's not astonishing that our mains water temperature was on the warm side for May, at 17°C in the middle of the month and 19°C at the end. More typical for mid-May is a degree ether side of last year's 15°C.
In terms of 16WW energy, PV generation was 24kWh/d, well up on the previous high of 21kWh/d and a mean (and original PVGIS prediction) of more like 18kWh/d. This microgeneration system is now over a decade old with no sign of flagging!
Self-consumption was 86%, which means that we're largely avoiding using the grid as a battery and reducing the flows inbound, mainly just leaving outflows spilling PV energy to grid and reducing our neighbours' carbon footprints.
Daily gross 'leccy consumption of 7kWh/d (ignoring PV and batteries) is higher than I'd like, and may drop a bit with our younger one back to school two days per week, and thus the Xbox and TV on less.
If our planned heat battery were in place then I anticipate that basically all of our 5kWh/d of gas consumption for hot water would have been diverted from our 18kWh/d of electricity exports. That would further reduce grid flows and avoid us burning anything at home other than the odd slice of toast.

Also on the 'raw' side after about three months' lockdown... According to xkcd.com each of our 100,000 head hairs grows at about half an inch per month, or an inch total between them every minute, or five feet every hour. Lies, damn lies, and statistics, but I do resemble those remarks right now!
[03:37]Audification
Today's data treat is also 16WW-related, from the logs of the EOU Web server that is powered with off-grid solar PV, at home in my kitchen cupboard!
My company was one of the first Internet Service Providers (ISPs) in the UK in the '90s, and some of the very first traffic I watched coming across our first live connection was malicious. I've learned to separate much bad vs legit traffic by eye over the years. I thought maybe it should be possible to make that difference audible.
Basically the observation is that some traffic types have observable patterns:
- Human traffic will likely show some sort of daily cycle, eg less traffic in the middle of the night.
- Malicious traffic can be very intense and bursty, not observing any etiquette of pacing traffic to be kind to the server, and since a lot of it is automated (ie code running amok by itself) has little daily pattern.
- Well behaved 'bots' or 'spiders' such as those run by search engines — Google, Bing, Yandex, etc — are also running all the time never sleeping, but are also measured and smooth and gentle in their requests.
If you look at the show notes for this episode you will see that I have taken three weeks' log data for May this year, all under lockdown, and compared it with two weeks' data from . I have stripped out information that might identify a human visitor, and applied some fairly simple classification of traffic to try to pick out subsets that fit some of the above categories.
[05:10]The results have been graphed and converted to audio in various ways.
Here is what all of one week's traffic from May sounds like with each day's traffic sped up to become one second of audio:
[...]
Every request made to the server is a 'hit', such as download of a page, and another hit for each of the images download to be shown within that page, for example. The traffic is counted in buckets one second long, of which there are 604,800 in a week. Most (more than 90% of) buckets are empty, ie with zero hits. A tiny handful (maybe a couple per week) have over 100 hits, usually from a particularly nasty attack attempt, or me running some stress-testing tool. Because the sites that feed these logs are quite small, the vast majority of buckets have eight hits or fewer; traffic is bursty. That was the mystery noise from the start of the episode, by the way.
I then pick out my own traffic, including the odd stress-test of my own systems. This has a strong daily cadence, including regular automatic refresh of a status page I keep an eye on, which refreshes faster when the off-grid battery is more full. This has been reported as sounding like creaking:
[...]
Basically anything that isn't me that announces itself as a bot in the "User-Agent" I have treated as such. This traffic is mainly polite and smooth, a fairly constant sizzle:
[...]
[07:13]Bad actors often masquerade as good actors, and don't set the fictional Evil Bit in their data packets to make it easy to shut them out! But bad actions are often clear, such as probing for weaknesses in popular servers and languages such as Wordpress and PHP (not used by EOU). This traffic happens all hours of the day and night, and features some loud 'pops' from rude unreasonably-intense brute-force requests.
Bad traffic is picked out as anything that requests something complex that doesn't exist, or is forbidden, that a normal human visitor's browser simply wouldn't try, or tries an access type (
POST) that EOU doesn't use. All bots and my own local traffic are excluded. Here is 'bad' traffic for the same May week:[...]
I deduce human beings to be behind traffic (other than my own or bots) that requests valid pages and media files (eg images and MP3). This does exhibit a daily cadence, like small waves washing on a beach, though with some possible masquerading bad-actor pops, if you listen carefully.
[...]
And here's a week from ...
Bot sizzle [...]
Bad pops [...]
Human waves [...]
Own creaks with a bit of stress-testing pop apparently [...]
Finally, here is three weeks of glorious lockdown traffic. Enjoy in the knowledge that when you fry bacon you may in fact be hearing bots and bad actors in the sizzle and the pops:
[...]
Do please read my extensive show notes for graphs, more sounds, and generally quite a lot more poking around in the data. Not to mention my wish list of other things that seemed interesting! There are also links to sources and to other podcasts that I've been listening too...
[10:13]Mystery number
Last month's mystery number stood at 34034 as I came towards the end of assembling that statscast. By early afternoon of June 10th it was 34684. So that's 650 new commits to the underlying repo from one month to the next. An audit trail and emotional roller coaster in one!
Shout out
I'm aiming to do a handful of 5-minute podcast interviews with listeners over the next week or so, to see if their lives are greener or less so under lockdown, and what the interviewees think will happen to their 'greenness' next. Please contact me if you'd be willing to take part!
More generally, please contact me if there's something that you'd like discussed on the podcast, maybe including you for a mini-interview!
Thank you!
There's more on my "Earth Notes" Web site at
Earth.Org.UK.

Show Notes
This episode seems to have taken a long time to put together, but I now have some more tools for making graphs and sounds from data, even if I didn't quite get to video this time!
Firstly, there was some HTML/CSS engineering to be done. I needed to fix the audio player to be responsive so that I could fit several instances across in the table here.
I am now able to generate .flac and .mp3 in batch from my data and then .wav means that I could generate a dataset or feed of such audio from site stats. Maybe I could auto-generate a separate data 'podcast' in future?
See the details below of how I made the sounds (and the graphs).
I am quietly pleased with some subtle DC-bias correction in the construction of the HitsPerSecond audio files. No one will ever notice!
As an experiment, I am editing out only the most egregious gasps for air and wet mouth noises. This saves a lot of time editing, and maybe sounds a bit more 'natural', but maybe you disagree?
This entire episode (including intro and outro) has had the new Audacity Loudness Normalization (-23dB LUFS perceived) applied. It might make the BBC happy, but I am not sure.
: transcription
I attempted a transcription with my now-favourite in-browser Transcobble, from the FLAC at maximum fidelity.
Something blew its mind about five minutes in, and I could only get Transcobble to generate output other than [s and ]s from there on by re-running at minimum/fastest setting. So there is an interesting graft in the middle.
Audification Data and Details
Here is a (tiny, tame, lightly-edited) sample of the log from my Apache Web server and its (default, "common log") format:
www.earth.org.uk:80 66.249.70.79 - - [17/May/2020:06:26:53 +0000] "GET /out/hourly/button/intico1-32.png HTTP/1.1" 200 1251 "-" "Googlebot-Image/1.0"
www.earth.org.uk:80 XXX.XXX.159.205 - - [17/May/2020:06:27:04 +0000] "GET /_gridCarbonIntensityGB.flag HTTP/1.1" 200 322 "-" "Mozilla/5.0 (X11; Linux x86_64) AppleWebKit/602.1 (KHTML, like Gecko) plasmashell/5.18.5 Version/10.0 Safari/602.1"
green.exnet.com:80 17.58.96.243 - - [17/May/2020:06:27:04 +0000] "GET /1995/ HTTP/1.1" 200 1198 "-" "Mozilla/5.0 (Macintosh; Intel Mac OS X 10_10_1) AppleWebKit/600.2.5 (KHTML, like Gecko) Version/8.0.2 Safari/600.2.5 (Applebot/0.1; +http://www.apple.com/go/applebot)"
m.earth.org.uk:80 158.69.245.202 - - [17/May/2020:06:27:30 +0000] "GET /robots.txt HTTP/1.1" 200 1296 "-" "Mozilla/5.0 (compatible; MJ12bot/v1.4.8; http://mj12bot.com/; ident=XXXX)"
- Multiple small sites (including EOU) are folded into these logs.
- These sites are mainly of interest to UK readers.
- Logs roll (ie start) weekly early Sunday morning (~6:30am).
- Logs (of a week long) have been captured from and .
Here is the simple anonymisation filter, in awk, which strips out personal information:
% cat logfile | awk '$7 !~ /"-"/ {t=$5;sub("^[[][^:]*:", "", t); u=$8;sub("[?].*$","",u); ua=$0;sub(/^.*\("[^"]*"\)$/,"\1",ua);bot=match($2,/^((79[.]135)|(192[.]168))[.]/)?"own":(match(ua,/[Bb]ot/)?"bot":"-"); print t, $7, u, $9, $10, bot}'
Local accesses show up as different IP addresses in and due to networking changes.
(Possible small improvement: extend the 'bot' matching (which will for example catch most of Google, Bing and Yandex search-engine traffic) to cover other common benign variants such as 'spider' and 'crawler' and the WebPageTest and Lighthouse tools. But some crude tests suggest that these account for a very small number of hits, eg ~1% level. Another group to capture as 'bot' might be those with 'http:' or 'https:' in the UA.)
Here is a sample of anonymised Web log data: the target site, the visitor's IP address and any URL parameters after a '?' are removed. The final field is 'bot' if the user-agent contains 'Bot' or 'bot', or 'own' if the access comes from my own network, so may be me, accessing or working on the site (~5% of log entries).
Fields are space-separated and in order are:
- time (hours, minutes, seconds) UTC
- verb (preceded by '"')
- request URL portion after host (etc) and stripped of query parameters
- protocol request type (usually HTTP/1.1, followed by '"')
- status code (200 OK, 206 partial eg for incremental audio or video)
- crude type field: 'bot' for bot, 'own' for own IP address or close.
06:26:07 "GET /rss/podcast.rss HTTP/1.1" 200 -
06:26:57 "GET /sitemap.atom HTTP/1.1" 200 -
06:28:33 "GET /data/WW-PV-roof/raw/sunnybeam.dump.20190501.txt HTTP/1.1" 304 bot
06:28:33 "HEAD //dedea/login.php HTTP/1.1" 404 -
06:28:33 "HEAD //guanli/login.php HTTP/1.1" 404 -
06:28:33 "HEAD //wang/login.php HTTP/1.1" 404 -
06:28:33 "HEAD //dede/login.php HTTP/1.1" 404 -
06:28:33 "HEAD //tdcq/login.php HTTP/1.1" 404 -
06:28:33 "HEAD //bob/login.php HTTP/1.1" 404 -
06:28:33 "HEAD //cgsw/login.php HTTP/1.1" 404 -
06:28:33 "HEAD //manage/login.php HTTP/1.1" 404 -
06:28:33 "HEAD //8sunbet/login.php HTTP/1.1" 404 -
06:28:33 "HEAD //hehe/login.php HTTP/1.1" 404 -
06:28:33 "HEAD //admin1/login.php HTTP/1.1" 404 -
06:28:33 "HEAD //login/login.php HTTP/1.1" 404 -
06:28:34 "HEAD //gsdd/login.php HTTP/1.1" 404 -
06:28:37 "GET /LED-lighting.html HTTP/1.1" 200 -
06:28:50 "GET /data/WW-PV-roof/raw/sunnybeam.dump.20160127.txt HTTP/1.1" 200 bot
06:29:01 "GET /img/a/b/thermal-imaging-of-house-interior-and-exterior-on-chilly-March-morning-about-4C-ambient-with-Flir-Systems-b50-in-Kingston-London-England-46-DHD.l53206.240x240.jpg HTTP/1.1" 304 bot
06:29:01 "GET /img/a/h/thermal-images-tiled-5x1-1280w.l111343.341x256.h.jpg HTTP/1.1" 304 bot
06:29:52 "GET /_off-grid-stats.html HTTP/1.1" 200 own
06:29:52 "GET /out/hourly/battV.png HTTP/1.1" 200 own
06:29:52 "GET /out/daily/battV-cm.png HTTP/1.1" 304 own
06:29:56 "GET / HTTP/1.1" 301 -
06:29:59 "GET /sitemap.atom HTTP/1.1" 200 own
06:30:00 "GET /rss/podcast.rss HTTP/1.1" 200 own
06:30:25 "GET /out/hourly/button/intico1-32.png HTTP/1.1" 200 -
06:30:54 "HEAD /rss/podcast.rss HTTP/1.1" 200 -
06:30:54 "HEAD /rss/podcast.rss HTTP/1.1" 200 -
06:30:54 "GET /rss/podcast.rss HTTP/1.1" 200 -
06:30:55 "GET /rss/podcast.rss HTTP/1.1" 200 -
06:31:08 "GET /img/MHRV-HR25H-on-tiled-wall.jpg HTTP/1.1" 304 bot
06:31:22 "GET /note-on-Raspberry-Pi-2-setup.html HTTP/1.1" 200 -
06:31:24 "GET /img/a/b/RPi-equipment-cupboard.l93865.400x270.jpg HTTP/1.1" 200 -
06:31:24 "GET /img/RPiServer/RPi-equipment-cupboard-800w.jpg HTTP/1.1" 200 -
06:31:24 "GET /img/s42/3/share42.js HTTP/1.1" 200 -
06:31:25 "GET /img/s42/3/icons.png HTTP/1.1" 200 -
06:32:02 "GET /1995/09/ HTTP/1.1" 200 -
06:32:03 "GET /1995/09/ HTTP/1.1" 200 -
06:32:03 "GET /1995/09/ HTTP/1.1" 200 -
06:32:36 "GET /img/washing/ZWD14581W.jpg HTTP/1.1" 200 own
06:32:36 "GET /favicon.ico HTTP/1.1" 200 own
06:32:41 "GET /out/hourly/button/intico1-32.png HTTP/1.1" 200 -
06:32:50 "GET /note-on-solar-DHW-for-16WW-UniQ-and-PV-diversion.html HTTP/1.1" 200 -
06:32:50 "GET /img/a/h/under-combi-20191215-1.l185327.640x80.l.jpg HTTP/1.1" 200 -
06:32:50 "GET /img/a/b/under-combi-20191215-1.l185327.400x300.jpg HTTP/1.1" 200 -
06:32:50 "GET /img/a/b/kitchen-boiler-cupboard-UniQ-destination-under-combi-5.l326525.264x524.jpg HTTP/1.1" 200 -
06:32:50 "GET /img/s42/3/share42.js HTTP/1.1" 200 -
06:32:50 "GET /img/a/b/kitchen-boiler-cupboard-UniQ-destination-under-combi-4.l247554.264x459.jpg HTTP/1.1" 200 -
06:32:50 "GET /img/a/b/under-combi-20191215-2.l108422.400x300.jpg HTTP/1.1" 200
This leaves enough features to crudely characterise visitor activity.
Blatant signs of malicious activity are attempts to POST (or, for example, PUT) rather than GET, and attempting to fetch a URL ending in .php. Also URLs starting with eg //, or /assets/ are characteristic of probing for bugs or weaknesses in servers. More broadly, practically any access that results in a 40x status code is malicious other than the occasional benign bot/spider; there are few bad inbound links that normal humans would encounter.
A week's worth of data is ~65k entries for some not-very-busy sites. (The anonymised log, gzipped, is ~500kB.) For reference, it seems that ~100 unique human visitors per day arrive at EOU, so the infrastructure has to support ~100 hits to support each human, only ~10 of them typically by each human, so ~90% overhead! A little under half of all hits are by bots, including search engines.
Data that may be interesting to visualise and/or audify are patterns of hits from:
- Bots (with
botin that final field). - Local accesses, ie including my
own. - Malicious accesses (URLs ending
.php, attemptedPOST, etc). - Redirected and Not Modified (3xx status) and client error (4xx) and server error (5xx) requests codes, and any correlation with malice.
- Status 304 "not modified" hits, ie where a transfer was avoided.
- Non-malicious, non-bot access to
.htmlURLs optionally also with.jpgand.png. - Non-bot/non-own access to
/favicon.icowhich may be a first-time visitor, or at least not recently visited, or a forced page reload by me! - Non-bot/non-own access to (podcast) audio/video, ignoring metadata preloads, likely status code 206.
- See if non-bot/non-malicious (ie human!) use has changed because of loading=lazy, eg hits spread out a bit more after initial page hit.
Hourly / daily / weekly patterns and/or spectral views are all potentially of interest, with some views such as:
- Basic count of hits for all and filtered traffic, for the pre- and during- covid samples.
- Histogram of hits per hour of day and per day of week for all and filtered traffic, for the pre- and during- covid samples.
- Graph and audification of hits as a timeseries for all and filtered data, for the pre- and during- covid samples.
- Video/audification of filtered hits as separate channels, eg bubble diagrams.
Tabulation
Note that all the filters are imperfect, to keep them simple, and because typical ways of improving fidelity involve access to potentially-identifying data (such as IP address.
The audio condenses one day of hits to one second, an 86400x speed-up! Anything above 8 hits per second is capped for the audio conversion, since well over 99% of seconds have no more hits than that, see below.
| Sample | 1 | all | 1 | all | Comment |
|---|---|---|---|---|---|
| Year-Month | |||||
| # Weeks | 1 | 2 | 1 | 3 | |
| Features | Lockdown | Lockdown | |||
| Method ( cat log.20{18,20}.{1,*}.gz | gzip -d | METHOD) | |||||
| Total hits ( wc -l) | 80803 | 146187 | 61192 | 174486 | No category filtering. No obvious daily or weekly pattern, eg noisy 'bacon frying' sound. |
| Total hits per day | 11543 | 10442 | 8742 | 8309 | |
| Total hits each second ( awk -f toHitsPerSecond.awk, gnuplot gnuplotHitsPerSecond.txt) |  |  |  |  | |
| Total hits each second ( awk -v ISAUDIO=1 -f toHitsPerSecond.awk, textToWAV - 86400) | 7s "HitsPerSecond" Uploaded . Downloads: | 14s "HitsPerSecond" Uploaded . Downloads: | 7s "HitsPerSecond" Uploaded . Downloads: | 21s "HitsPerSecond" Uploaded . Downloads: | |
| % total hits each hour of day ( awk -f toHourOfDay.awk, gnuplot gnuplotHourOfDay.txt) |  | 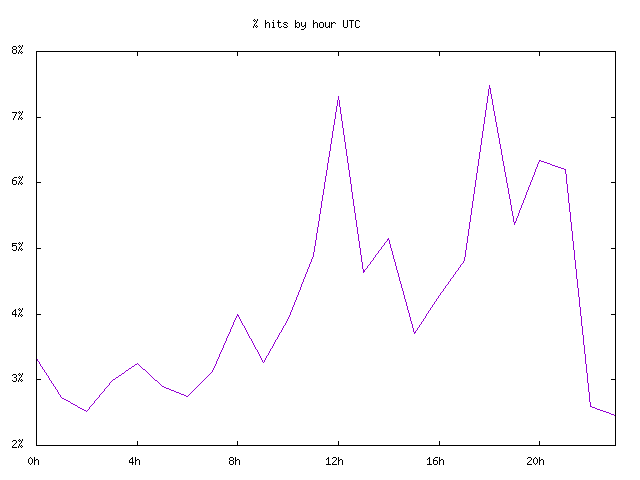 |  |  | |
| % total hits each day of week ( awk -f toDayOfWeek.awk, gnuplot gnuplotDayOfWeek.txt) |  |  |  |  | |
| Own hits (%) ( awk -f filterOwn.awk | wc -l) | 27029 (33%) | 38350 (26%) | 2662 (4%) | 7247 (4%) | Spidering and stress testing bursts during set, none during set. There is a clear daily pattern with, for example, a ~72Hz component for 20-minute real-time intervals (rising as high as ~288Hz for 5-minute intervals when the battery is full and the refresh rate is maximum) from regular automatic refresh of a key status page while my browser is open. Cheekily this was suggested to me as sounding like bedsprings, though I have no idea what that's about... |
| Own hits each second ( awk -f filterOwn.awk | awk -f toHitsPerSecond.awk, gnuplot gnuplotHitsPerSecond.txt) |  |  |  |  | |
| Own hits each second ( awk -f filterOwn.awk | awk -v ISAUDIO=1 -f toHitsPerSecond.awk, textToWAV - 86400) | 7s "HitsPerSecond Own" Uploaded . Downloads: | 14s "HitsPerSecond Own" Uploaded . Downloads: | 7s "HitsPerSecond Own" Uploaded . Downloads: | 21s "HitsPerSecond Own" Uploaded . Downloads: | |
| % own hits each hour of day ( awk -f filterOwn.awk | awk -f toHourOfDay.awk, gnuplot gnuplotHourOfDay.txt) |  | 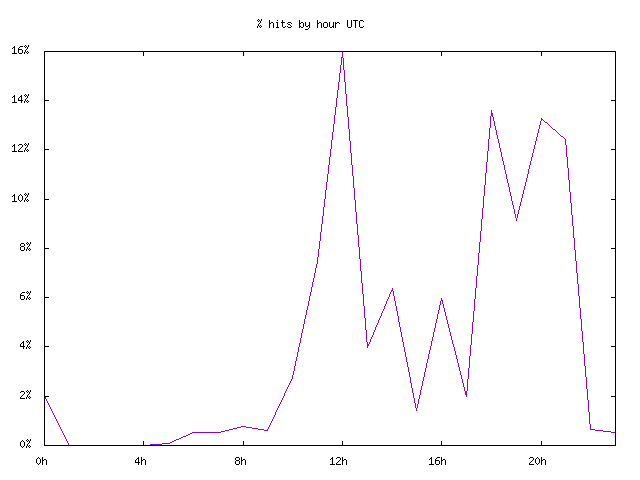 |  | 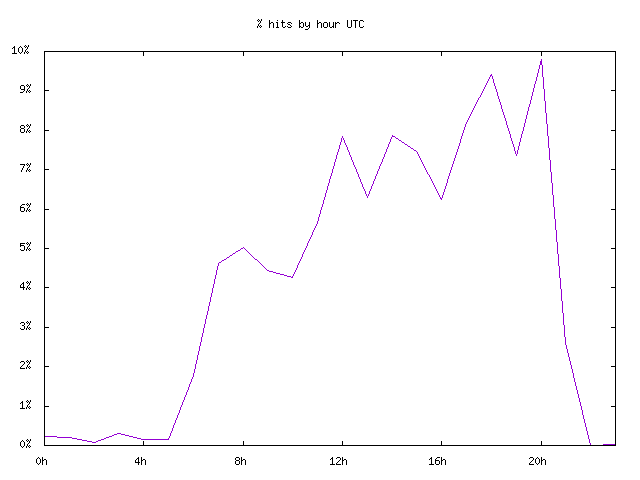 | |
| % own hits each day of week ( awk -f filterOwn.awk | awk -f toDayOfWeek.awk, gnuplot gnuplotDayOfWeek.txt) |  | 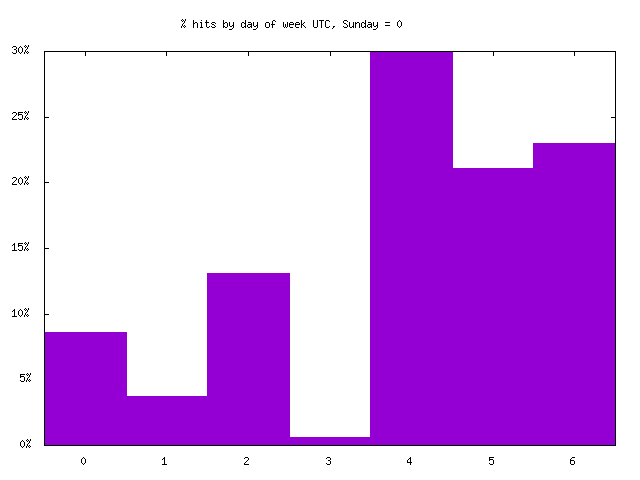 | 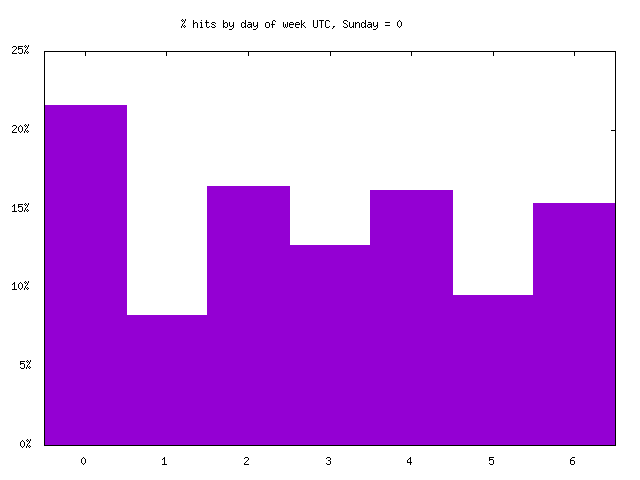 |  | |
| Bot hits (%) ( awk -f filterBot.awk | wc -l) | 18420 (23%) | 33872 (23%) | 17667 (29%) | 49603 (28%) | If all spiders and crawlers including search engines and SEO tools etc are folded in this would probably be just below 50%. (Some of the most greedy are shut out using robots.txt.) Again, not much discernible pattern by day or week, but relatively smooth non-bursty traffic from well-behaved bots. |
| Bot hits each second ( awk -f filterBot.awk | awk -f toHitsPerSecond.awk, gnuplot gnuplotHitsPerSecond.txt) |  |  |  |  | |
| Bot hits each second ( awk -f filterBot.awk | awk -v ISAUDIO=1 -f toHitsPerSecond.awk, textToWAV - 86400) | 7s "HitsPerSecond Bot" Uploaded . Downloads: | 14s "HitsPerSecond Bot" Uploaded . Downloads: | 7s "HitsPerSecond Bot" Uploaded . Downloads: | 21s "HitsPerSecond Bot" Uploaded . Downloads: | |
| % bot hits each hour of day ( awk -f filterBot.awk | awk -f toHourOfDay.awk, gnuplot gnuplotHourOfDay.txt) |  |  |  |  | |
| % bot hits each day of week ( awk -f filterBot.awk | awk -f toDayOfWeek.awk, gnuplot gnuplotDayOfWeek.txt) |  |  |  |  | |
| Bad (malicious) hits (%) ( awk -f filterBad.awk | wc -l) | 3353 (4%) | 6225 (4%) | 11654 (19%) | 29685 (17%) | Big jump in malicious hits in ; possibly just more PHP attacks. Not much discernible pattern by day or week, but bursty/clicky and concentrated, eg from short-duration brute-force attacks. |
| Bad hits each second ( awk -f filterBad.awk | awk -f toHitsPerSecond.awk, gnuplot gnuplotHitsPerSecond.txt) |  |  |  |  | |
| Bad hits each second ( awk -f filterBad.awk | awk -v ISAUDIO=1 -f toHitsPerSecond.awk, textToWAV - 86400) | 7s "HitsPerSecond Bad" Uploaded . Downloads: | 14s "HitsPerSecond Bad" Uploaded . Downloads: | 7s "HitsPerSecond Bad" Uploaded . Downloads: | 21s "HitsPerSecond Bad" Uploaded . Downloads: | |
| % bad hits each hour of day ( awk -f filterBad.awk | awk -f toHourOfDay.awk, gnuplot gnuplotHourOfDay.txt) |  |  |  | 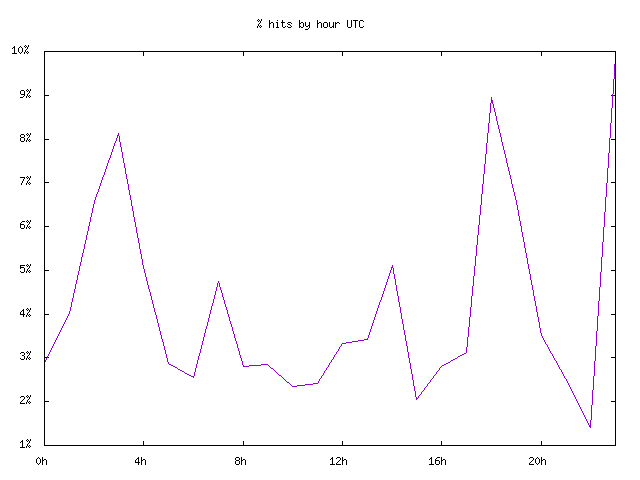 | |
| % bad hits each day of week ( awk -f filterBad.awk | awk -f toDayOfWeek.awk, gnuplot gnuplotDayOfWeek.txt) |  |  | 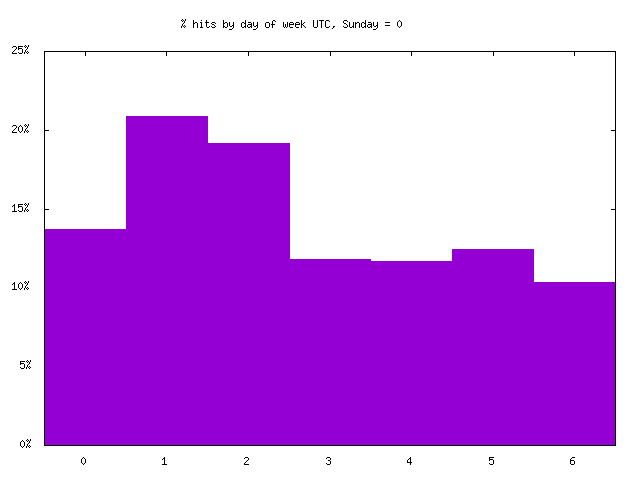 |  | |
| Human hits (%) ( awk -f filterHuman.awk | wc -l) | 19416 (24%) | 44862 (30%) | 16245 (27%) | 48860 (28%) | There is a slight consistent daily pattern here, with browsing/access activity by hour in line with the sites and users being UK-focussed. |
| Human hits each second ( awk -f filterHuman.awk | awk -f toHitsPerSecond.awk, gnuplot gnuplotHitsPerSecond.txt) |  |  |  |  | |
| Human hits each second ( awk -f filterHuman.awk | awk -v ISAUDIO=1 -f toHitsPerSecond.awk, textToWAV - 86400) | 7s "HitsPerSecond Human" Uploaded . Downloads: | 14s "HitsPerSecond Human" Uploaded . Downloads: | 7s "HitsPerSecond Human" Uploaded . Downloads: | 21s "HitsPerSecond Human" Uploaded . Downloads: | |
| % human hits each hour of day ( awk -f filterHuman.awk | awk -f toHourOfDay.awk, gnuplot gnuplotHourOfDay.txt) |  |  |  | 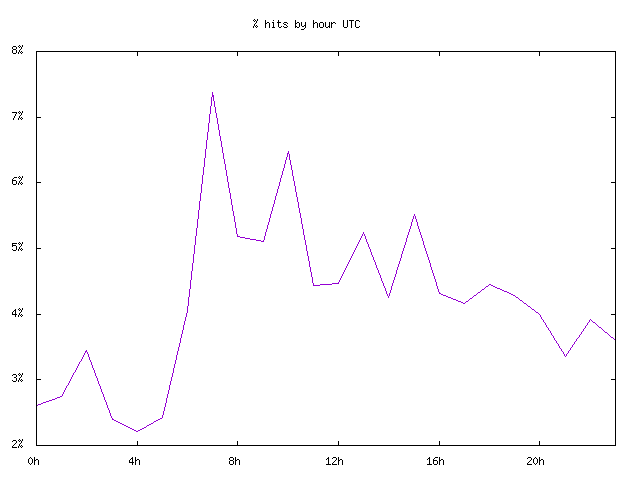 | |
| % human hits each day of week ( awk -f filterHuman.awk | awk -f toDayOfWeek.awk, gnuplot gnuplotDayOfWeek.txt) |  |  |  |  |
Bursty
Just as an example of how bursty load can be, taking each 1-second bucket in one week's data (from ) and seeing how many buckets have each hit count, 640k buckets are empty, 41k have 1 hit, 5k have 2 hits, to a couple of seconds of the week that had over 100 hits each (most likely legitimate local test spidering or stress-testing). Hits in the tens per second are just about possible when browsing image-laden pages.
% cat log.2018.1.gz | gzip -d | awk -f toHitsPerSecond.awk | sort -n | uniq -c
640372 0
40740 1
4665 2
1512 3
1481 4
 685 5
 410 6
 310 7
 250 8
 154 9
 153 10
  96 11
  46 12
  26 13
  22 14
  10 15
  13 16
  12 17
   9 18
   7 19
  10 20
   5 21
   8 22
   4 23
   6 24
   3 25
  11 26
  10 27
  12 28
   7 29
  21 30
   7 31
   7 32
   4 33
   6 34
   1 38
   1 41
   1 42
   1 45
   1 47
   1 64
   1 74
   1 85
   1 93
   1 94
   1 128
   1 146
Googlebot

Given the ~2400 bot hits per day in the data, we can look at another source to see if that seems plausible.
Recent stats from Google's Search Console (GSC) suggest that for EOU (which is not the only site with hits in the logs, but probably the majority), average items ('pages') and MB crawled per day for the 'www' version was 413 and 24, with peaks of 1027 and 100 occurring in samples 2 and 3.
Googlebot is only one 'bot', though the biggest of the search engine bots by traffic. There are all sorts of other self-declared bots, such as for SEO tools. So Google accounting for somewhere between 400 and 1000 of the ~2400 total daily hits seems reasonable.