Earth Notes: Statscast - Load Profile (2020-12)
Updated 2025-12-23.Statscast
Hi, I'm Damon Hart-Davis, and welcome to Earth Notes podcast on all things eco and green and efficient @Home!
, for stats from to .
Turn-of-the-month update of home energy and related stats, and poking at data from 16WW.
This is a short episode, and I will largely ignore the wider world except to note that even covid didn't bring down carbon emissions enough to make a useful difference in . We're going to have to work much harder at fixing the climate than some would like, but that isn't news!
was warm and our central heating didn't go on until . The start of November is more typical.
I'm happy to report as a side note [that] the bats around 16WW were still busy well into and even detectable from my study window on the !
[01:03]16WW load profile vs typical
This time I'm looking at our electricity 'load profile' at home at 16WW, ie how much electricity we use at each time of day.
Most households on the GB grid are both on non-smart meters and also on [an] 'all-day' tariff. So even though the underlying wholesale price of electricity can vary greatly, users pay a flat rate and remain oblivious. And their retail suppliers don't know how much they've actually used when.
To that end there is
profiling, where the typicalload profileorload curveof different types of electricity consumers are measured. The first couple of profiles in GB are for domestic customers on a completely flat or 'unrestricted' tariff, and those on Economy 7.[01:50]Retailers have to pay for wholesale electricity as if their customers on non-smart meters were all consuming in line with their profile. I'm interested to see how much we differ from from the standard profile, if at all, given our solar PV, Enphase AC battery, and various other tweaks.The show notes have a more detailed analysis, but the upshot is that in winter, 16WW gross consumption (ignoring PV and battery), is not wildly different to the typical home. In particular, consumption is lowest at night, and peaks in the evening for cooking for our evening meal.
But our consumption at night is much lower than usual given all our efforts to kill 'vampire' loads. And our evening peak is maybe higher than usual because our cooking is all-electric (induction hob and fan electric oven).
[02:37]That is 'gross' consumption, as if we had no PV or battery. But looking at what actually flows from (and to) the grid, the difference from typical is much bigger.
For example, imports from the grid drop to zero around noon on average, even in December, in part because PV can directly carry much of the load then. Sometimes it cannot, and we import. Sometimes PV is more than enough and we charge the battery or even export or
spillto the grid. And December is the time of year with the lowest PV generation...It's also clear that we are shaving about 10% off our peak demand in the 4pm to 7pm slot with the battery. Not running appliances (such as the dishwasher) and the central heating then will also be helping.
[03:21]Note that even if our battery storage was doubled we likely wouldn't shave off 20% at peak time since there is not that extra energy available from the solar PV to charge the storage.
I'm happy that these efforts are probably doing some good.
I just took a quick test at
climatehero.mewhich reckoned that each adult at 16WW had a footprint not far off from a climate-friendly two tonnes of CO2 per year, which is good.If everybody [was below 2 tonnes of CO2 per year], we could immediately avoid the threat of climate change.It was suggested that "neutralising" our
whole remaining footprint only costs $3 per month!I put much more than that into working directly on climate fixes, such as Radbot. So I passed on this carbon offset offer...There's more on my "Earth Notes" Web site at
Earth.Org.UK.
Show Notes
Apologies for some ham-fisted audio editing. There were a few distractions...
The script to generate the profile from Enphase data is at script/storesim/load_profile.sh.
See also the gnuplot script used to generate the charts.
The data that I'm after from Elexon looks as if it may be historical "D0018".
Detailed Analysis
Raw data
The raw data is gathered from the Enphase monthly net energy report. The Enphase simultaneously and accurately measures grid import/export, PV generation, and battery charge/discharge. The net energy report does a fairly good job of extracting a gross-consumption figure also.
A sample of this data is:
Date/Time,Energy Produced (Wh),Energy Consumed (Wh),Exported to Grid (Wh),Imported from Grid (Wh),Stored in AC Batteries (Wh),Discharged from AC Batteries (Wh)
2020-12-01 00:00:00 +0000,0,14,0,15,1,0
2020-12-01 00:15:00 +0000,0,25,0,26,1,0
2020-12-01 00:30:00 +0000,0,16,0,17,1,0
2020-12-01 00:45:00 +0000,0,15,0,16,1,0
2020-12-01 01:00:00 +0000,0,29,0,30,1,0
2020-12-01 01:15:00 +0000,0,28,0,29,1,0
2020-12-01 01:30:00 +0000,0,59,0,60,1,0
2020-12-01 01:45:00 +0000,0,51,0,52,1,0
2020-12-01 02:00:00 +0000,0,27,0,28,1,0
Start of December 2020
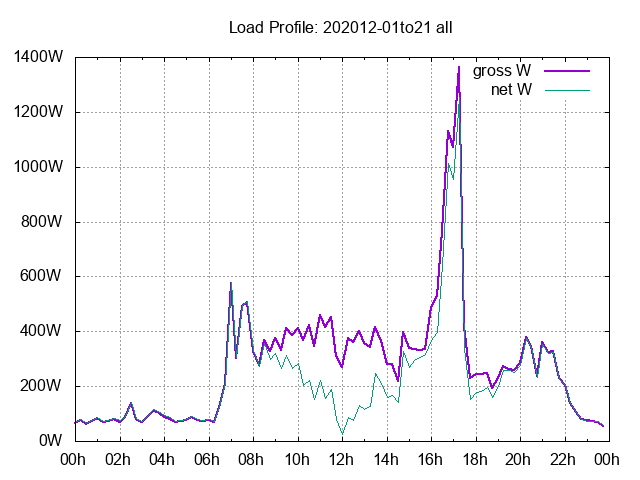
The above load profile for 16WW is for the initial 21 'normal-ish' days of . This shows both gross consumption as if there were neither PV nor battery, and net consumption from the grid after the effect of those two. ~10% mean is clipped from peak grid net imports by the battery. Sunset is a little before 4pm for this period. (Chart data CSV file.) This is derived from Enphase 15-minute "Monthly Net Energy" data. Note that the Enphase has been set up with a nominal peak-rate setting on weekdays only to cover the 'peak' peaks, from 4pm to 6:59pm, and the central heating boiler is disabled during the same interval, to help reduce grid imports then.
Although the first three weeks of December avoids the unique Christmas period, it was also the most recent data I could get due to problems with the Enlighten portal.
Looking at the 5pm peak, it is there in both weekday and weekend data. The Enphase has not been set up to hold back any charge to help with the 4pm to 7pm slot at weekends, and so nothing is shaved off the peak there, though it's lower anyway.
 |  |
| CSV | CSV |
June 2020

In contrast, in June 16WW can be seen almost never to import on average, and to be a significant net exporter. Night loads such as the fridge-freezer are covered by the battery. Note that Enphase times are local, ie BST or UTC+1 here. (Chart data CSV file.)
In June 5pm is no longer the dominant peak at weekends!
 |  |
| CSV | CSV |
Elexon
Comparing the start-of-December weekday gross consumption curve to Elexon's average winter weekday for Profile Class 1 — Domestic Unrestricted Customers
(non-Economy-7), there is more then a passing resemblance. 

There are a few differences worth pointing out:
- Our gross-consumption peaks are sharper because we are one family with fairly consistent habits.
- Our gross-consumption peaks are likely higher because we cook all-electric (induction and fan oven).
- Our night gross-consumption is likely lower at least in part because we've removed many power vampires.
- Our net-consumption curve is significantly different, eg dipping to zero at noon.
Note that this start-of-December weekday data only has data from 15 days. Also, covid and lockdown is distorting these figures with us home more than we might otherwise be, for example.
CO2 emissions by hour
Having done all this I then computed for 2020 a per-hour CO2 emissions trace for 16WW (negative when exporting to grid and thus displacing emissions elsewhere). 
Official profile data
Elexon was as ever very helpful pointing me at a sample of 'official' data (thank you Angus!). The linked spreadsheet on their profile page seems good for this purpose.
Converting the Elexon BSC Profiling page's linked Average profiling data per Profile Class spreadsheet to a CSV and projecting out the profile class one winter weekday column yields:
% awk -F, < 201314.csv '{print $1 "," $(NF-2)}'
Profile Class 1,
,
Settlement period,Wtr Wd
00:30,0.352
01:00,0.313
01:30,0.294
02:00,0.278
02:30,0.266
...
Note that the times are the instant at the end of each half-hour slot, and the demand figures are in kW.
Adjusting the times to be the start of the buckets can be done with a little bit of awk trickery:
% awk -F, < 201314.csv '/^[0-2]/ {printf("%0.2d:%0.2d:00,%f\n", int(m/60), m%60, 0+$(NF-2)); m+=30}'
00:00:00,0.352000
00:30:00,0.313000
01:00:00,0.294000
01:30:00,0.278000
02:00:00,0.266000
...
Getting it into the same form as for the 16WW data from the Enphase such as
% head img/PV/load-profile/202012/bucketed.202012-01to21.weekday.csv
00:00:00,15,64,68
00:15:00,15,72,76
00:30:00,15,61,65
00:45:00,15,67,71
01:00:00,15,82,86
...
But with gross and net the same, and a nominal single sample, and in watts, yields:
% awk -F, < 201314.csv '/^[0-2]/ {w=int($(NF-2)*1000+0.5); printf("%0.2d:%0.2d:00,1,%d,%d\n", int(m/60), m%60, w, w); m+=30}' > img/PV/load-profile/202012/bucketed.elexon-winter.weekday.csv
00:00:00,1,352,352
00:30:00,1,313,313
01:00:00,1,294,294
01:30:00,1,278,278
02:00:00,1,266,266
...
Feeding that into the gnuplot script with:
% gnuplot -e "title='Load Profile: Elexon winter weekday'" -e "infilename='img/PV/load-profile/202012/bucketed.elexon-winter.weekday.csv'" graphing/storesim/load-profile-1.txt
yields (in wide format):
: Beast From the East II

A view of demand from when "Beast From the East II" arrived, with high gas consumption days (eg >40kWh/d, ) between the and the .
The heating is off from 4pm to 7pm, and the house coasts thermally then. The only heavy load that routinely happens in that slot (we avoid washing and dishwashing for example) is cooking with induction hob and fan oven.
: Load Profile with Heat Pump
I started capturing profiles more systematically from once the heat pump was in.
: first full month
A quick check if our electricity load profile has significantly changed since , given the new heat pump and some DHW/CH load shifting tweaks, using data for the first 19 full days in December, with extended scripts. 
A re-run on for the whole of , messed up as it is by the holiday season and various faults/reconfigurations, was made with sh script/storesim/load_profile.sh 202412. 
Hourly hph4 heat pump consumption for the whole of was made with sh script/storesim/load_profile.sh -hph4 202412. 
hph4) load profile over whole of . Demand is indeed being steered away from to .
Hourly eheat heat pump consumption plus diversion/boost (boost is pasteurisation) for the whole of was made with sh script/storesim/load_profile.sh -eheat 202412. 
eheat) to capture pasteurisation cycles over whole of .