Earth Notes: Bulk Electricity Storage @Home (2018)
Updated 2022-09-18.The device that initially piqued my curiosity this time was the Enphase AC Battery which looked as if it might be as little as £1k to get 1kWh of storage, in a very small box that I could tuck beside my consumer unit and have deal with trickle/constant loads such as the fridge overnight. (Turns out to be more like £3k, installed, with a supporting control/meter box, but still, very interesting. Note that a Tesla Powerwall 2 might only cost a little over double, but with over ten times the storage and over twenty times the power capability.)
I've fired off a number of requests to potential suppliers, of the form:
Current PV system: 5.2kWp grid-tie system over 4 x Sunny Boy SMA inverters/strings, 3 strings on one meter/tariff, 1 on a newer tariff. Import, export and 2x generation meters installed.
(Also, separate off-grid system, ~700Wp with 2kWh lead-acid storage.)
Requirement:
A/c coupled storage system to increase self-consumption by:
- covering night loads to avoid night-time grid draw (~70W/1kWh) spring/summer/autumn
- and/or to cover up to 2kW to 3kW of peak load to avoid any grid draw during day for all but winter months.
Note: typical gross consumption per day 6kWh of which ~25% is covered direct from the PV across a year.
Would very much like to monitor (via WiFi / MODBUS or similar) and/or have the opportunity to manage from existing control hub to control overall charge/discharge regime. Would prefer all control to be local, ie no dependency on live Internet connection/account.
Please give me an indication of cost and space requirements, and lead time.
The lead time for an installation seems to be nearer months than weeks!
Motivation and Discussion
I think it's worth being clear about my motivation for this.
I'm not doing this to save money. I'm doing this partially experimentally and mainly as a (small, expensive) carbon-reduction exercise, reducing grid losses/strain shipping energy in and out of the house.
I want to develop ideas about how to manage storage in an efficient (carbon-cutting) way, and this would give me scope to tinker. Fiddling with my off-grid RPi system power management C++ code has been educational, for example.

Note that storage used in this way is absorbing some of the intermittency (spikiness) of demand as well as of PV generation. Normally the grid does a good job of evening out very short-term demand spikes by being a grid, summing demands of many millions of consumers, but those back-and-forth flows do have losses.
This is in some way a continuation of the ideas in Domestic Dynamic Demand Ideas, including "Sola Sava", for better self-consumption of renewables.
This is also about how solar PV can potentially provide core power overnight without huge brute-force storage capacity or complexity, most of the year. Below are some selected posts from the thread. Me: ... The market has moved on, and though I'd still be paying more in raw storage terms than for my lead-acid gel off-grid battery storage of that time, this is packaged, installed, with data access, etc. And done right meets G83 and G100 and shouldn't upset my current FiT arrangements. I'm not doing this to save money. I'm doing this partially experimentally and mainly as a (small, expensive) carbon-reduction exercise, reducing grid losses/strain shipping energy in and out of the house. There may be a bigger store added in parallel with this later, even up to seasonal store. ... If the council doesn't pull my house down under CPO in the interim. WillInAberdeen Damon, wouldn't it be better for the environment if you exported the solar energy and displaced some fossil generation? The premise of the FiT and export tariff is that those of us without solar, should subsidise those of you with solar to export it, to everyone's net benefit. Grid tied storage feels like that bargain is broken, though not as bad as immersion diverters. What does the carbon intensity data on this say? Haven't checked earth.org for a while. Me: It *is* best to displace ff generation on the grid with solar. This doesn't change the amount of that displacement that happens (ie net exports are the same), it simply stops some of the back-and-forth across the local distribution system which is lossy and puts a strain on the local grid. This can also shave some peak-time loads by shifting when residual load is presented to the grid. The losses in grid vs the battery are probably a wash, even with an efficient lithium-chemistry system. But avoiding using the grid as if it were a battery is a good thing. Shaving peak demand is a good thing, and almost certainly a (carbon) saving one way or another IMHO. WillInAberdeen Hi Damon, shouldn't people export solar during the daytime peak when grid intensity is high, then import at night when intensity is lower? You have written extensively on this. Do people still claim Export tariff at deemed 50% of generation, even though they are not exporting anything? Paid for by me! but also by the folk on the sharp end of the energy poverty wedge. This encourages people to dump publicly-subsidised solar power into immersion heaters. Me: So, I would still (in winter, say) be running my dishwasher overnight and importing the bulk of that then. (I might only be able to supply ~25% of peak ~2kW demand from local storage.) The question of what actually fires up to deal with an extra 1kW of grid demand, eg because someone stopped spilling PV generation to grid, remains open. It's probably CCGT most of the time, but when there is no pumped storage being released to grid I take it that shifted grid demand at that time is effectively extra grid storage. But also look at: I'm still in several minds about diverting PV to resistive heating for many of the reasons you outline and that I have raged on before. But if that storage is efficient (eg such as Sunamp's v low losses compared to an actual hot water tank) or you are relieving the grid of peak flows around solar noon, then it may be less bad though to actually good. (If that heat storage were via a heat-pump preserving exergy, then I see that as being likely much better.) But generally doing whatever is possible to reduce peak demand (and flows) by importing less or exporting more is good. A flat grid demand (or matching intermittents' availability) is a cheaper and lower-carbon one, I think. ... WillInAberdeen Damon, you mentioned storing solar power to run dishwasher and washing machine overnight. Would you get the same effect if you just run them during the daytime solar generating period? maybe develop some software using the weather forecast to decide when the optimum time would be, interface the delayed start function of the appliance? You also mentioned storing power to run the fridge/freezer overnight. Would you get the same effect by chilling them down during the day then switching them off overnight, maybe with some freezer blocks or bottles of salty water to act as stores of cold? Use a time switch or a pv diverter to switch them back on during generation times? Me: When it's sunny I do try to run the dishwasher during the day. However if it's at all cloudy it can be hit and miss. If the generation is not >> 2kW for the entire first hour or so then the couple of spikes of consumption while heating water may not be fully covered by generation. Batteries could partly or fully fix that. Also, when it is sunny, I do attempt to take the opportunity to load up the fridge with beer or wine to store cool, yes, but that's going to be small fry. And I'm not going to risk damaging the fridge or our health messing about with turning them of or off. I already bought the most efficient I could that fitted our requirements: http://www.earth.org.uk/note-on-Siemens-KG34NA10GB-upright-fridge-freezer-REVIEW.html The washing machine timing is more tricky because it has to fit with drying days, etc, but we tend to run it to finish when we get up, which while not minimum grid demand and CO2, is better than peak. And we run very few hot washes; a fair percentage are run cold: http://www.earth.org.uk/note-on-Zanussi-ZWD14581W-freestanding-washer-dryer-REVIEW.html PS. I used to have my system automatically start my old dishwasher at a 'optimum' time by turning on the power. But the new one with electronic controls starts in a silly state sometimes and that is not possible. Something like Green Bean https://github.com/GEMakers/green-bean would be lovely, but I don't have access to any such thing. Later in the thread... WillInAberdeen Can you correlate the time of day of consumption with your grid intensity report? IE work out: Is the difference +ve or -ve, did you actually save some CO2 overall? I kicked off a Green Building Forum thread on this topic...
See also a Fieldlines thread on this topic.
FiT for Purpose
My FiT administrator says that I should be aware of recent Ofgem guidance and "whether the installation of the battery effects the generation meter."
An important point from the Ofgem document is that "For the purposes of the RO and FIT schemes, we consider that in most cases a co-located storage facility would not be considered part of the RO generating station or the FIT installation. This is because storage is not directly referenced as an eligible generating technology under either of the RO or FIT schemes, and in most cases, the storage facility will not be essential to the operation of the generating station or installation.
Also If the storage facility can only be charged by the FIT installation or the storage facility is installed after the generation meter, then it would be clear that the generation meter only measures generation from the accredited FIT installation.
I am proposing to have the storage "after" the generation meter, connected to the consumer unit.
However, by default my export meter would be between the storage and the grid so if the storage were to cause export to the grid that export would not be eligible for FiT export payments. So either I could attach the storage between the (inner, house-side) export meter than the (outer, grid-side) import meter, causing any exports from the storage to be disregarded. Or maybe I'd be permitted to switch from metered exports to 'deemed' (50% of generation), but retaining the meter for my own records.
2018-07-20: the latest communication from my FiT administrator, after sharing with them a 'standard' (Enphase AC Battery) connection schematic into the consumer unit, was reassuring:
Providing the battery is between the Generation meter and Export capable meter as shown in the schematic you've provided, this should not affect your current Feed-in Tariff. As your generation meter will still clock the true amount of generation with the battery downstream of it, and the export meter will still clock true export with the battery upstream of it.
2018-08-15: I mailed the schematic received from the installer today to the FiT administrator and received the response:
I can confirm that at the moment with the current regulations, this does not alter your Feed-in tariff account. We will be in contact with you if any changes are made to this.
Sizing
A sizing suggestion, ie rule of thumb, made to me by a potential supplier, was that for each 1kWh/day of gross consumption, there should be 2kWp of PV and 2kWh of storage. For us that would mean doubling our PV size and ~12kWh of storage (roughly a Powerwall 2), but interesting in any case!
A typical night may have one or both of the dishwasher and washing machine running, the former just under 1kWh and the latter around 1kWh if not a cold wash else much lower. Then the fridge/freezer (~1kWh/d, so 0.3 to 0.6kWh) and a few tens of watts extra 'vampires'.
The Enphase (~1kWh/260W) might cover our fridge/freezer plus constant small loads, but not the bigger overnight loads above, currently scheduled then in part to be kind to the grid already.
A meatier system with ~2.5kW or greater power capacity could support the dishwasher or washing machine (~2kW peak while heating water), plus the loads that the Enphase could carry. ~2.5kWh energy capacity would keep them off the grid. Maybe another 0.5kWh would support lights and TV and some hot drinks while the sun is down.
Note that our kettle is 3kW, so 3kWh/3kW could potentially cover most incidental loads outside winter when the sun is down.
YouGen suggests making sure that the power output is at least 3.6kW.
In any case, continuing to schedule kitchen loads overnight means that when/if the storage runs out then residual demands on the grid are at a relatively good time.
For covering (low) night loads the trigger import load to start generating will need to be checked. If too high then the night loads simply won't be satisfied from the storage.
The biggest single always-present night-time load is our fridge/freezer. Note from a .csv spreadsheet/data of 1 minute samples that the load mean was 42W (1.02kWh/d), max 356W, typically 0W or 75W. (See graph of fridge/freeze power draw too.) So triggering reliably at/under 75W would seem to be important. Our TV and cable box together come in at ~40W, which might typically be accompanied by 20W of lighting after sun-down. To cover that, a reliable trigger at/under 60W would be needed.
Brands Considered
Brands/products considered so far, at least to some degree:
- BYD
- Look fairly industrial. Not had much positive info about BYD 'systems', and don't want to be stringing something Heath Robinson together.
- Enphase AC Battery
- May be able to inject energy precisely enough to prevent imports as low as 5W. Not obvious if this will work fully given that we have two separate solar generation meters/feeds and the Envoy S seems to only monitor one. Not obvious if data downloads to my server can be automated. Round-trip cell efficiency 96%. Round-trip inverter max efficiency 97%. 1.2kWh battery unit size/spacing 45x31x22cm with 30cm above and below.
- Sample UK vendor 1 ecopartnersuk.com: £4495 2.4kWh including fitting, commissioning, VAT 2018-07-13.)
- Sample UK vendor 2
thesolarpeople.co.uk: £3937 2.4kWh kit including VAT + UK mainland delivery 2018-07-18.) - Tesla Powerwall 2
- 1150 mm x 755 mm x 155 mm. Round-trip efficiency > 90%. 13.2kWh capacity. 3.68kW charge/discharge power.
- Did not respond to my query about the minimum load supported, but did use my info to SPAM me about Tesla Model 3 availability... Not good.
- Moxia
- Not received any response to my enquiries.
- OutBack GridZero (or Mini Grid) mode inverter chargers
- GridZero import trigger load seems to be 240W/1A.
- Powerflow Sundial M2/S2
- Master and slave 2kWh nominal (1.6kW actual), max output power ~500W. Size ~44/30/28cm. Minimum trigger power on import is 170W (confirmed in email by manufacturer), which would fail to engage for our typical night loads.
- Powervault 3
- 120x98x25cm for 4kWh and 8kWh units; 20cm space needed for airflow. 3.3kW max charge rate for both. 4.6kW max continuous power/discharge for 4kWh unit, 5.5kW for 8kWh.
- As of 2018-07-31 Powervault cannot tell me the PV3 minimum/trigger load. From this GBF thread 2019-01-10: "The minimum loads and/or generation required to discharge or charge the Powervault 3 are ~200W - 250W."
- sonnen eco 8.0 and 9.43
- The 2kW (8/2) version is the wall-mounted unit alone, which I could accommodate, but everything else is huge and I couldn't. Would struggle to cover my 2kW/3kW peak loads for that use case. Trigger limit 30W (and same for eco 9; email from sonnen UK).
- The eco 9.43/2,5 capacity 2.5kWh (and /5 is 5kWh); DoD 90%. Charge/discharge power 1.1kW and 2.5kW. Cabinet 1 size 88/67/23cm. Trigger limit 30W (as for eco 8; email from sonnen UK, and supporting data seen from a live system).
- Tesla Powerwall 2
- 1150 mm x 755 mm x 155 mm. Round-trip efficiency > 90%. 13.2kWh capacity. 3.68kW charge/discharge power.
- Victron ECOmulti
- The marine blue may prove too industrial a look. Have previously considered Victron in other configurations to achieve a similar effect, but tied to lead-acid storage.
Note this helpful insight from Matei Predescu of solarsouthwest.co.uk:
[Re Powerflow] ... I've suggested it because, like the others, it's one of the few AC batteries out there. Most of these battery companies are relatively new and not that different, since the battery technology inside is mostly the same and comes from the same few companies (Samsung, LG, etc). The only thing differentiating them would be the BMS and how well it was thought out, since it is responsible for basically keeping the battery as healthy as possible, for as long as possible.
: Deposit Down

Excitement: I have today put down the deposit on a modest system. I should have a shiny new storage testbed installed within a month of starting the search for storage this time around. Hurrah!
Oh, and yet more data, live and slightly-less live. In particular, accurate granular import and export data, and thus also accurate granular gross consumption data. I may get away with less manual meter reading in future! Indeed, with gas, import and export and generation all electronic I may no longer need to read 6 meters every day.
(I did just have a glitch with my Loop gas meter sensor which meant that I lost a month's worth of daily data, so some manual reading from the calibrated supply meters as backstop is still a good idea.)
Histogram of PV Generation Power
This is based on 1-minute samples of generation. (A few samples are randomly missing.)
For 2017-12, in 250W buckets, the histogram looks like this:
250 9217
500 1796
750 971
1000 467
1250 23
1500 2
(Note that daily generation figures for 2017-12 range from 0.34kWh to 2.73kWh.)
For 2018-01 (January is generally the second-lowest-generation month):
250 8709
500 2814
750 1020
1000 650
1250 318
1500 60
1750 8
For 2018-03 (shoulder month):
250 7359
500 3252
750 2844
1000 1978
1250 1341
1500 757
1750 474
2000 434
2250 339
2500 328
2750 147
3000 134
3250 51
3500 12
3750 3
4000 2
4250 1
For 2018-06 (contains the longest day):
250 5018
500 2563
750 2470
1000 2198
1250 1952
1500 1662
1750 1383
2000 1216
2250 1084
2500 1181
2750 1244
3000 1384
3250 1910
3500 1256
3750 385
4000 92
4250 30
4500 9
4750 6
(See the script used to generate the histogram data from the raw Sunny Beam power samples.)
This indicates how much of the time absorption of available generation would be limited by the storage's charging power limit.
In each case the largest single bucket is up-to-250W, ie less than 5% of nominal peak power for this E/W split PV array, though that is clearly not the majority of samples in June. (250W is within the charge rate of a single Enphase AC Battery, even ignoring any loads present to absorb some of that generation.)
A significant mismatch arises from those appliances that heat water, and do so close to the limit of a 13A supply, ie 2kW to 3kW. Those appliances consume a significant fraction of our daily electricity budget, maybe one third. Our induction hob is in similar territory per ring, and our electric oven even higher at ~4kW.
That is, an ideal storage system should be able to discharge much faster than it need charge to cover the majority of loads and generation.
Equally, a relatively small store could avoid significant exports in winter to retain the energy for use in the house. But use of large appliances will cause some imports other than in the very sunniest moments and/or with a much larger storage discharge power capacity.
Simulation
I am working on a simple simulation script to see how a battery like the Enphase might work with my house loads.
FLATW Constant Flat Loads Only
2017-07-29: an early cut with simulated completely flat/constant (~10W) house load (FLATW), from fans and steady vampires, etc, in 2017-12, together with some flat self-consumption by the storage system itself (SSSCW):
% sh script/storesim/batsim1.sh
NOT graphing.
FPVGENW: file input for PV generation 1 minute samples: data/SunnyBeam/201712.gz
PREVHHMM: PV generation padded from after / to: 23:59
FLATW: constant/flat household consumption (W): 10
SSSCW: storage system self-consumption (W): 10
SCAPWh: effective/usable storage capacity (Wh): 1100
SMINCDW: minimum supported charge/discharge (W): 5
SRTEFF: storage round-trip efficiency (fraction): 0.9
*** RESULTS
Sim mins 44640 TgenWm 2563295 TloadWm 892800 TnetflowWm 1670495 TabsnetflowWm 2968669 TbattchgWm 0 TadjgridflowWm 1.05971e+06 TrawimportsWm -649087 TfinalimportsWm -174053
Sim days 31 (kWh/d) Tgen 1.37812 Tload 0.48 Tnetflow 0.898116 Tabsnetflow 1.59606 Tbattchg 0 Tadjgridflow 0.569738 Trawimports -0.348972 Tfinalimports -0.0935771
The first thing to note is that mean daily generation is calculated here as ~1.4kWh/d (Tgen) or 42.7kWh total (TgenWm/60000). The real generation meter readings were 1.5kWh/d or 45.8kWh, so ~7% low. I think that the Sunny Beam report from the inverters is always conservative, and there may be other errors afoot.
The Tadjgridflow value suggests that ~0.57kWh/d of flow in and out of the house would be prevented (a flow in either direction is counted here), which is not quite half the generation.
Also, net imports with the battery are 0.09kWh/d (Tfinalimports), vs 0.35kWh/d with the battery ignored. Note though 0.24kWh/d of that import is from the storage's own standing consumption. So the real import saving is ~0.1kWh/d imports saved of 0.24Wh/d compared to no storage system at all. In any case, the ~3kWh total final import for the whole month is impressive. That would drop towards zero if the trigger level for supporting imports were lower that 5W (SMINCDW).
FLOADCYCW Cycling Loads
More realistically, this adds the main always-there fridge/freezer load. This is exactly one day of real sampled data, albeit when the fridge/freezer was a bit younger. The fridge/freezer data represents an additional load of ~1kWh/d.
% shscript/storesim/batsim1.shNOT graphing. FPVGENW: file input for PV generation 1 minute samples:data/SunnyBeam/201712.gzFLOADCYCW: file input for cyclic house loads:img/PV/storesim/fridge-40W-1m-cycle.datPREVHHMM: PV generation padded from after / to: 23:59 FLATW: constant/flat household consumption (W): 10 SSSCW: storage system self-consumption (W): 10 SCAPWh: effective/usable storage capacity (Wh): 1100 SMINCDW: minimum supported charge/discharge (W): 5 SRTEFF: storage round-trip efficiency (fraction): 0.9 *** RESULTS Sim mins 44640 | (Wm) TgenWm 2563295 TloadWm 2785660 TnetflowWm -222365 TabsnetflowWm 4160675 TbattthroughputWm 1.3502e+06 TadjgridflowWm 2.55736e+06 TrawimportsWm -2191520 TrawexportsWm 1969155 TfinalimportsWm -984358 TfinalexportsWm 618956 Sim days 31 | (kWh/d) Tgen 1.37812 Tload 1.49767 Tnetflow -0.119551 Tabsnetflow 2.23692 Tbattthroughput 0.725914 Tadjgridflow 1.37493 Trawimports -1.17824 Trawexports 1.05869 Tfinalimports -0.529225 Tfinalexports 0.332772
Trawimports has risen to 1.2kWh/d (from 0.35), ie PV is not covering the extra load well. Averted imports are now 0.65kWh/d (-(Tfinalimports - Trawimports)), resulting in a residual 0.53kWh/d. Battery throughput (Tbattthroughput) is 0.73kWh/d. Averted grid flows (Tadjgridflow) sit at ~1.4kWh/d, or about twice the averted imports given poor matching of instantaneous PV cover for load in December. (Lots of night, lots of low generation even in the day.)
Exports are reduced from 1.1kWh/d to 0.33kWh/d. So self-consumption is ~1kWh/1.4kWh per day, ie 73%.
A 'perfect' storage system would have reduced imports to 0.12kWh/d (Tload - Tgen), and exports to zero, given that load exceeds generation over the month simulated.
Note that no upper/maximum limits on charge/discharge power have yet been imposed in the simulation. Such limits result in more flow leakage due to high load and generation power spikes that the storage cannot fully handle.
SMAXCDW: Maximum Charge/Discharge Power
Limiting charge/discharge power (SMAXCDW, treated as symmetric) gives:
% shscript/storesim/batsim1.shNOT graphing. FPVGENW: file input for PV generation 1 minute samples:data/SunnyBeam/201712.gzFLOADCYCW: file input for cyclic house loads:img/PV/storesim/fridge-40W-1m-cycle.datPREVHHMM: PV generation padded from after / to: 23:59 FLATW: constant/flat household consumption (W): 10 SSSCW: storage system self-consumption (W): 10 SCAPWh: effective/usable storage capacity (Wh): 1100 SMINCDW: minimum supported charge/discharge (W): 5 SMAXCDW: maximum supported charge/discharge (W): 260 SRTEFF: storage round-trip efficiency (fraction): 0.9 *** RESULTS Sim mins 44640 | (Wm) TgenWm 2563295 TloadWm 2785660 TnetflowWm -222365 TabsnetflowWm 4160675 TbattthroughputWm 1.25755e+06 TadjgridflowWm 2.38604e+06 TrawimportsWm -2191520 TrawexportsWm 1969155 TfinalimportsWm -1.06302e+06 TfinalexportsWm 711609 Sim days 31 | (kWh/d) Tgen 1.37812 Tload 1.49767 Tnetflow -0.119551 Tabsnetflow 2.23692 Tbattthroughput 0.6761 Tadjgridflow 1.28282 Trawimports -1.17824 Trawexports 1.05869 Tfinalimports -0.571518 Tfinalexports 0.382585
That reduces averted gross final grid flows (Tadjgridflow) from 1.37kWh/d to 1.28kWh/d, so by ~10%.
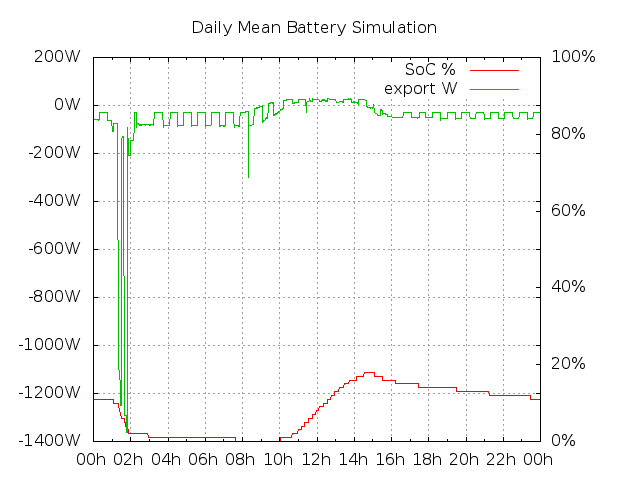
Note that the battery is on average exhausted (zero SoC % / State of Charge) by 8am, but charging again by 10am (UTC, my local solar time, near enough). 
GRAPHOUT=daymean) simulation of single Enphase AC 1.1kWh battery with 16WW fridge/freezer load against 2017-12 PV generation.
Compare with PV for 2018-06 (almost all imports avoided, battery never less than about half full, nadir 4am, on average):
im mins 43200 | (Wm) TgenWm 40566232 TloadWm 2695800 TnetflowWm 37870432 TabsnetflowWm 39923116 TbattthroughputWm 1.07321e+06 TadjgridflowWm 1.99109e+06 TrawimportsWm -1026342 TrawexportsWm 38896774 TfinalimportsWm -108457 TfinalexportsWm 3.78236e+07
Sim days 30 | (kWh/d) Tgen 22.5368 Tload 1.49767 Tnetflow 21.0391 Tabsnetflow 22.1795 Tbattthroughput 0.596226 Tadjgridflow 1.10616 Trawimports -0.57019 Trawexports 21.6093 Tfinalimports -0.0602537 Tfinalexports 21.0131

GRAPHOUT=daymean) simulation of single Enphase AC 1.1kWh battery with 16WW fridge/freezer load against 2018-06 PV generation.Second Battery Pack
Simulating adding a second battery pack (SMAXCDW 520W, SCAPWh 2200Wh, SSSCW 17W) raises averted gross final grid flows to 1.7kWh/d, ie ~33%, doesn't always run out by morning, and reduces exports to ~0.1kWh/d for 2017-12:
% sh script/storesim/batsim1.sh SSSCW=17 SCAPWh=2200 SMAXCDW=520
NOT graphing.
FPVGENW: file input for PV generation: data/SunnyBeam/201712.gz
FLOADCYCW: file input for cyclic house loads: img/PV/storesim/fridge-40W-1m-cycle.dat
PREVHHMM: PV generation padded from after / to: 23:59
FLATW: constant/flat household consumption (W): 10
SSSCW: storage system self-consumption (W): 17
SCAPWh: effective/usable storage capacity (Wh): 2200
SMINCDW: minimum supported charge/discharge (W): 5
SMAXCDW: maximum supported charge/discharge (W): 520
SRTEFF: storage round-trip efficiency (fraction): 0.9
*** RESULTS
Sim mins 44640 | (Wm) TgenWm 2563295 TloadWm 3098140 TnetflowWm -534845 TabsnetflowWm 4349313 TbattthroughputWm 1691583 TadjgridflowWm 3.16617e+06 TrawimportsWm -2442079 TrawexportsWm 1907234 TfinalimportsWm -967491 TfinalexportsWm 215651
Sim days 31 | (kWh/d) Tgen 1.37812 Tload 1.66567 Tnetflow -0.287551 Tabsnetflow 2.33834 Tbattthroughput 0.909453 Tadjgridflow 1.70224 Trawimports -1.31295 Trawexports 1.02539 Tfinalimports -0.520157 Tfinalexports 0.115941
(See graph.)
sonnen 9.43/5
A simulation of the sonnen 9.43/5 (with standing losses guessed) comes somewhere between 1 and 2 Enphase units in terms of averted grid flows and final exports, though is worse on final imports:
sh script/storesim/batsim1.sh SSSCW=20 SCAPWh=5000 SMAXCDW=2500 SMINCDW=30
NOT graphing.
FPVGENW: file input for PV generation: data/SunnyBeam/201712.gz
FLOADCYCW: file input for cyclic house loads: img/PV/storesim/fridge-40W-1m-cycle.dat
PREVHHMM: PV generation padded from after / to: 23:59
FLATW: constant/flat household consumption (W): 10
SSSCW: storage system self-consumption (W): 20
SCAPWh: effective/usable storage capacity (Wh): 5000
SMINCDW: minimum supported charge/discharge (W): 30
SMAXCDW: maximum supported charge/discharge (W): 2500
SRTEFF: storage round-trip efficiency (fraction): 0.9
*** RESULTS
Sim mins 44640 | (Wm) TgenWm 2563295 TloadWm 3232060 TnetflowWm -668765 TabsnetflowWm 4431555 TbattthroughputWm 1.63405e+06 TadjgridflowWm 2.96823e+06 TrawimportsWm -2550160 TrawexportsWm 1881395 TfinalimportsWm -1.21597e+06 TfinalexportsWm 247350
Sim days 31 | (kWh/d) Tgen 1.37812 Tload 1.73767 Tnetflow -0.359551 Tabsnetflow 2.38256 Tbattthroughput 0.878519 Tadjgridflow 1.59582 Trawimports -1.37105 Trawexports 1.0115 Tfinalimports -0.653748 Tfinalexports 0.132984
(See graph.)
Adding the Dishwasher
We usually set up our dishwasher on its ECO cycle to run circa 1am when grid demand and carbon intensity are low. (When sunny, it may get run during the day instead.)
The ECO cycle uses about 0.8kWh, mainly in a couple of bursts of ~2kW to heat water, but also with some fairly steady consumption for the circulation pump (~100W) until the final drying is hit.
Adding that into the mix empties a single Enphase battery rather sooner, importing 1.4kWh/d of 2.3kWh gross consumption (0.38kWh/d is still exported):
FLOADCYCW: file input for cyclic house loads: img/PV/storesim/fridge-dishwasher-1m-cycle.csv
...
Sim mins 44640 | (Wm) TgenWm 2563295 TloadWm 4271335 TnetflowWm -1708040 TabsnetflowWm 5650784 TbattthroughputWm 1.25863e+06 TadjgridflowWm 2.3881e+06 TrawimportsWm -3679412 TrawexportsWm 1971372 TfinalimportsWm -2.54994e+06 TfinalexportsWm 712744
Sim days 31 | (kWh/d) Tgen 1.37812 Tload 2.29642 Tnetflow -0.918301 Tabsnetflow 3.03806 Tbattthroughput 0.676682 Tadjgridflow 1.28392 Trawimports -1.97818 Trawexports 1.05988 Tfinalimports -1.37094 Tfinalexports 0.383196
(See graph.)
With that load the sonnen 9.43/5 is depleted even sooner in the night, and manages to reduce exports to 0.13kWh/d, but possibly only by consuming the difference itself, as imports are much the same as the Enphase!
Sim mins 44640 | (Wm) TgenWm 2563295 TloadWm 4717735 TnetflowWm -2154440 TabsnetflowWm 5921610 TbattthroughputWm 1648168 TadjgridflowWm 3.12342e+06 TrawimportsWm -4038025 TrawexportsWm 1883585 TfinalimportsWm -2.56278e+06 TfinalexportsWm 235417
Sim days 31 | (kWh/d) Tgen 1.37812 Tload 2.53642 Tnetflow -1.1583 Tabsnetflow 3.18366 Tbattthroughput 0.886112 Tadjgridflow 1.67926 Trawimports -2.17098 Trawexports 1.01268 Tfinalimports -1.37784 Tfinalexports 0.126568
(See graph.)
An Enphase 2-battery solution is looking interesting here. It's not on average entirely depleted before sunrise, exports and imports are the lowest of the three configurations at 0.12kWh/d and 1.3kWh/d respectively:
Sim mins 44640 | (Wm) TgenWm 2563295 TloadWm 4583815 TnetflowWm -2020520 TabsnetflowWm 5839386 TbattthroughputWm 1693392 TadjgridflowWm 3.21032e+06 TrawimportsWm -3929953 TrawexportsWm 1909433 TfinalimportsWm -2.41303e+06 TfinalexportsWm 216041
Sim days 31 | (kWh/d) Tgen 1.37812 Tload 2.46442 Tnetflow -1.0863 Tabsnetflow 3.13945 Tbattthroughput 0.910426 Tadjgridflow 1.72598 Trawimports -2.11288 Trawexports 1.02658 Tfinalimports -1.29733 Tfinalexports 0.116151
(See graph.)
The 2-battery system reduces imports and exports a little, even though on average there is not enough daily generation to cover the load. A little more of the PV generation is captured (when over 260W), and a little more of the dishwasher peak demand is covered too.
This scenario has a total load (gross consumption) of ~2.5kWh/d, when in real life our load is more like 5kWh/d or 6kWh/d. So this is still a crude approximation.
Adding Light, TV, Laptop
Still omitting heavy loads such as cooking and clothes washing, but now folding in a steady ~100W load to cover work from home and watching TV in the evening, etc, gets to:
% sh script/storesim/batsim1.sh FLOADCYCW=img/PV/storesim/fridge-dishwasher-light-work-TV-1m-cycle.csv
NOT graphing.
FPVGENW: file input for PV generation: data/SunnyBeam/201712.gz
FLOADCYCW: file input for cyclic house loads: img/PV/storesim/fridge-dishwasher-light-work-TV-1m-cycle.csv
PREVHHMM: PV generation padded from after / to: 23:59
FLATW: constant/flat household consumption (W): 10
SSSCW: storage system self-consumption (W): 10
SCAPWh: effective/usable storage capacity (Wh): 1100
SMINCDW: minimum supported charge/discharge (W): 5
SMAXCDW: maximum supported charge/discharge (W): 260
SRTEFF: storage round-trip efficiency (fraction): 0.9
*** RESULTS
Sim mins 44640 | (Wm) TgenWm 2563295 TloadWm 7247335 TnetflowWm -4684040 TabsnetflowWm 7236252 TbattthroughputWm 823062 TadjgridflowWm 1.56382e+06 TrawimportsWm -5960146 TrawexportsWm 1276106 TfinalimportsWm -5.21939e+06 TfinalexportsWm 453044
Sim days 31 | (kWh/d) Tgen 1.37812 Tload 3.89642 Tnetflow -2.5183 Tabsnetflow 3.89046 Tbattthroughput 0.442506 Tadjgridflow 0.840762 Trawimports -3.20438 Trawexports 0.686078 Tfinalimports -2.80612 Tfinalexports 0.243572
A single battery's charge does not make it far into the night, and is fading fast during the evening peak. It only manages to shift a little energy from afternoon to early evening.
Gross load/consumption in this simulation is 3.9kWh/d, compared to a typical real-world 5--6kWh/d for winter. Exports are down to 0.24kWh/d out of 1.38kWh/d generation. This avoids exporting and then re-importing ~0.4kWh/day.
(See graph.)
By March, most small imports are suppressed until just after midnight. The battery is empty by ~2am. (Bumping up to 2 batteries will mostly suppress the small imports all night.)
(See graph.)
Come June, however, all small night-time imports are being suppressed. Only energy for the dishwasher is being imported, ie ~0.8kWh/d, and that could usually be shifted to the day instead to be directly covered by PV, some cheeky clouds notwithstanding.
(See graph.)
Washing and Cooking
I could usefully add in ~1kWh/d for our washing machine, and 1kWh/d for cooking our evening meal.
Note that so far a constant load pattern has been used throughout the year, even though it does change. In the winter there is more lighting, and extra demand for running the gas boiler for central heating.
Expected Change
Now that I have ~1kWh of storage installed, what change should I expect to see in practice?
Simply put, I would like to see 1kWh/d less export (used to charge the store) and 1kWh/d less import (when the house is powered from the store rather than the grid). So 2kWh/d less gross flow across the DNO's wires running to my house. (And maybe 10p/day saved on the difference between the cost of one less unit to import at retail rates vs the 'lost' export unit under the FiT!)
In winter, when there is not always 1kWh/d of PV generation, that target won't be hit.
For other reasons, such as instantaneous loads or PV generation too big for the Enphase to handle, that target won't be hit.
Note however that there may be some intraday flows, such as helping to cover some big loads such as cooking, and then immediately recharging, that may nominally cause the target to be beaten. I don't anticipate much of this, but it does add to the wanted 'smoothing' of grid demands.
Some Real Data
Having not found the data I wanted in the Enlighten Web interface (it turns out the installer needed to enable some features) I worked out how to get it direct from the Envoy-S. My RPi now polls the Envoy over the LAN.
Taking approximately 5-minute samples (which is how often updates to storage are available) and crudely munging actuals in in place of simulated values for the first day for which I have been logging, can be seen below. 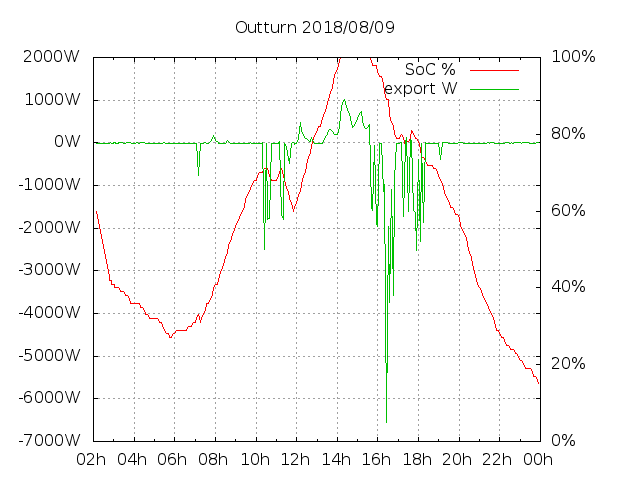
It turns out to have been a humdinger of a day for consumption (~9.5kWh), with lots of cooking and two dishwasher runs, one of which was the pots-and-pans 'max' programme. Peak load during cooking was close to 7kW!
Interestingly TV plus lights plus other background loads (~75W) plus the fridge/freezer auto-defrost (~190W, ~25mins) maxes out the single Enphase unit. That is, only ~20W is pulled from the grid. Sailing closer to the wind than I thought would happen on a 'normal' evening.
2018-08-11: a day where we were mostly away and so loads were small (~2.2kWh) and only ~0.2kWh was imported. (Log) 
(The ~500W spike in consumption at 19:55Z was likely a transient from the fridge/freezer starting. They notoriously require hugely overspecified inverters to run compared to their average demand. The dip just before 08:00Z was our breakfast cooking briefly overcoming the efforts of PV and battery.)
2018-09-15 note: non-wet-goods night-time loads are largely covered (so 1kWh/d less exported then imported, at ~80--90% efficiency), but peak-time (4--7pm) loads for cooking only a little (270W/~2kW). It's not yet clear if this helps grid management or carbon reduction.
2018-09-19 thought: I have been pondering if it is better use of sunshine to run the washing machine overnight as now so that clothes can be hung up outside ASAP to maximise drying time, or to delay starting the machine until the sun is up to maximise self-use of PV generation and be an hour or two later onto the washing line... Maybe if the morning is cold, the energy is better put into the wash and spin than ineffectual drying?
2018-10-06: very overcast day, generation 0.8kWh, like a poor mid-winter day! Virtually all of that self-consumed, partly due to the battery. (~0.81kWh produced, <0.01kWh exported, ~5.45kWh consumed, ~4.4kWh imported.) Battery is empty before dusk, having never charged over 5%. Having more capacity, even at low charge/discharge power like the Enphase. could allow some energy to be carried over more than one day. That could provide more self-consumption even when daily demand is higher than daily production.
: Imports Averted
Summing column 7 of the "monthly net energy" reports emailed by Enlighten on demand shows the amount of energy extracted (Wh) from the battery that presumably therefore avoided a matching import from the grid.
A simple script below shows that in shoulder months that more than the battery's capacity is extracted each day, ie there is noticeable intraday cycling. The Enphase AC Battery is nominally specified for two full cycles per day, which I am getting nowhere near.
% foreach f ( net_energy_201*gz )
foreach? echo $f
foreach? gzip -d < $f | awk -F, '{sum+=$7}END{print sum}'
foreach? end
net_energy_201808.csv.gz
20879
net_energy_201809.csv.gz
38264
net_energy_201810.csv.gz
35774
net_energy_201811.csv.gz
24349
net_energy_201812.csv.gz
15369
net_energy_201901.csv.gz
21550
net_energy_201902.csv.gz
28823
net_energy_201903.csv.gz
38031
net_energy_201904.csv.gz
33960
net_energy_201905.csv.gz
33929
net_energy_201906.csv.gz
29378
net_energy_201907.csv.gz
30008
net_energy_201908.csv.gz
27150
net_energy_201909.csv.gz
39170