Earth Notes: On Website Technicals (2026-01)
Updated 2026-02-17.: Uptime 150 Days
Yes, sencha has today gone that long without a crash or reboot.
: 168
168 days...
: Zstandard
Most browsers support br and gzip Content-Encoding. Almost every HTTP supports gzip.
I precompress popular/important text resources, primarily the top-level 'main' EOU pages, with brotli and zopfli. My Apache server will gzip on the fly anything else suitable, at very low time and CPU cost for server and client.
Increasingly, browsers now support zstd (Zstandard) compression, and when I upgrade my server there is a chance that Apache will too.
It seems unlikely that off-line static compression by brotli will in practice be beaten by Zstandard, so I will stick with the former for best compression of HTML and SVG and the like, see an example below, and Zstandard does not seem to beat zopfli significantly:
% zstd --ultra -22 < index.html > index.htmlzs
% ls -alS index.html{,br,gz,zs}
-r--r--r--  1 dhd  staff  24680 28 Jan 10:18 index.html
-r--r--r--  1 dhd  staff   9381 28 Jan 10:18 index.htmlgz
-rw-r--r--  1 dhd  staff   9379 28 Jan 10:19 index.htmlzs
-r--r--r--  1 dhd  staff   8013 28 Jan 10:18 index.htmlbr
But also at the default compression levels of gzip/zlib and zstd as likely to be used in Web servers, Zstandard does not seem to help my case much:
% gzip < index.html | wc -c
   9643
% zstd < index.html | wc -c
   10044
So I will not be rushing to turn off zopfli static compression, with its very high client compatibility and low CPU/memory burden, nor rushing to do anything special to enable Zstandard for dynamic compression.
: No Glossary Sub-Pages
For now I have stopped generating Glossary sub-pages, since they are duplicates of the main page, and have lots of hurdles to overcome such as image inclusion.
: Energy Series Sub-Pages
The energy series page with all its embedded HTML tables/charts has been getting huge:
609487 energy-series-dataset.html
 46366 energy-series-dataset.htmlgz
 31475 energy-series-dataset.htmlbr
On my to-do list for a while has been splitting out the tables (see example below) into 'sub-pages', ie separate pages for each table in a sub-directory, updated only when necessary. Today (and in dribs and drabs over previous days) that was done.
| Source: Eddi | |||
|---|---|---|---|
| Date | kWh | Events | |
| 2024 | *187 | [34] | |
| 2025 | 909 | [36, 37] | |
| Source: Eddi | |||
This has to work for mobile/lite and off-line pages, and I also took the opportunity to parallelise the process, since this is 'embarrassingly' parallel.
Much smaller! Yellow Lab Tools has stopped complaining quite so hard about the (new) energy series page, with its 2039 DOM elements; 1500 or under would get a clean sheet!
117257 energy-series-dataset.html
 14019 energy-series-dataset.htmlgz
 11300 energy-series-dataset.htmlbr
: All Indexed
As of this morning, and after some weeks of wrestling with this, all EOU main pages (ie top-level HTML pages listed in the site map) are reported in GSC (Google Search Console) as indexed. (This is down from 45 Crawled - currently not indexed
at , for example: the figure had reached the mid-50s at one point.) Thus they are all available to appear in Google Search results.
Separately, I note that Google Discovery performance (clicks, impressions) for EOU has been zero for about six months.
: 2 not
As of today, two pages are in Crawled - currently not indexed
.
So that was to inclusive with everything officially indexed...
: Consolidation Optimisation
The consolidated (kWh) energy stats are assembled by a script which until now has been purely sequential, and has taken ~116s on my Mac M1 not in lowpowermode. It typically gets forced to run once per day, in make when new PV generation stats are available, and can interrupt my thinking!
A couple of micro-optimisations on the side saved a couple of seconds.
Parallelising the section that generates synthetic (formula-based) series with xargs reduced its runtime from ~36s to ~13s, bringing the whole script runtime to ~91s.
INFO: TS: START: 53.311: Sun 18 Jan 2026 17:56:53 UTC: Darwin localhost 25.2.0 Darwin Kernel Version 25.2.0: Tue Nov 18 21:09:55 PST 2025; root:xnu-12377.61.12~1/RELEASE_ARM64_T8103 arm64
INFO: TS: START DIRECT GEN: 53.357
INFO: TS: END DIRECT GEN: 03.876
INFO: TS: START SYNTH GEN: 03.890
INFO: TS: END SYNTH GEN: 16.485
INFO: TS: START COLLAPSE: 16.498
INFO: TS: END COLLAPSE: 18.254
INFO: TS: START CONSOLIDATE: 18.266
INFO: TS: END CONSOLIDATE: 22.657
INFO: TS: START SONIFY: 22.669
INFO: TS: END SONIFY: 24.565
INFO: TS: END: 24.577
INFO: TS: TOTAL: 91s
This uses 8 cores on my M1, and seems to make good use of the RPi3's 4 cores.
There is plenty remaining that should admit relatively easy optimisation, both parallelisation and single-thread performance, but this was fine for a weekend's between-gig-and-clubbing recreational hacking!
As is often the way, being forced to re-examine and re-understand the code in order to optimise it, has allowed some code clean-ups in passing.
: order order!
An old-fashioned bit of order-reduction from O(n^2) to O(n) in the merge script took its worst-case time down from ~56s to ~0.2s:
sh script/consolidate/energy/mergeAcrossSources.sh data/consolidated/energy/std/gen/D/SunnyBeam/gen-D-SunnyBeam.csv data/consolidated/energy/std/gen/D/Enphase/gen-D-Enphase.csv
The whole main consolidation script time is now ~30s on the M1 MBA without lowpowermode, ~150s on the RPi3 main server sencha:
INFO: TS: START: 16:43:50.355: Mon 19 Jan 2026 16:43:50 UTC: Darwin localhost 25.2.0 Darwin Kernel Version 25.2.0: Tue Nov 18 21:09:55 PST 2025; root:xnu-12377.61.12~1/RELEASE_ARM64_T8103 arm64
INFO: TS: START DIRECT GEN: 16:43:50.399
INFO: TS: END DIRECT GEN: 16:44:00.816
INFO: TS: START SYNTH GEN: 16:44:00.828
INFO: TS: END SYNTH GEN: 16:44:13.308
INFO: TS: START COLLAPSE: 16:44:13.320
INFO: TS: END COLLAPSE: 16:44:15.070
INFO: TS: START CONSOLIDATE: 16:44:15.084
INFO: TS: END CONSOLIDATE: 16:44:17.626
INFO: TS: START SONIFY: 16:44:17.638
INFO: TS: END SONIFY: 16:44:19.458
INFO: TS: END: 16:44:19.470
INFO: TS: TOTAL: 29s
Synthetic order
Looking again at the synthetic generation, an example case takes ~8s on my MBA, ~11s in lowpowermode:
% time sh script/consolidate/energy/synthSources.sh heat-M-synth > /dev/null
2.655u 4.222s 0:07.57 90.7%	0+0k 0+0io 3795pf+0w
...
% time sh script/consolidate/energy/synthSources.sh heat-M-synth > /dev/null
4.243u 6.220s 0:11.40 91.7%	0+0k 0+0io 3795pf+0w
Reducing to O(n) gets the run time down to ~0.06s, and the main consolidation script time is now ~18s on the M1 MBA without lowpowermode, ~83s on the RPi3 main server sencha:
INFO: TS: START: 20:33:13.782: Mon 19 Jan 2026 20:33:13 UTC: Darwin localhost 25.2.0 Darwin Kernel Version 25.2.0: Tue Nov 18 21:09:55 PST 2025; root:xnu-12377.61.12~1/RELEASE_ARM64_T8103 arm64
INFO: TS: START DIRECT GEN: 20:33:13.827
INFO: TS: END DIRECT GEN: 20:33:24.287
INFO: TS: START SYNTH GEN: 20:33:24.300
INFO: TS: END SYNTH GEN: 20:33:24.767
INFO: TS: START COLLAPSE: 20:33:24.778
INFO: TS: END COLLAPSE: 20:33:26.554
INFO: TS: START CONSOLIDATE: 20:33:26.567
INFO: TS: END CONSOLIDATE: 20:33:29.237
INFO: TS: START SONIFY: 20:33:29.249
INFO: TS: END SONIFY: 20:33:31.209
INFO: TS: END: 20:33:31.222
INFO: TS: TOTAL: 18s
So yesterday's shiny new parallelism is not getting to do much!
I turned off some detailed logging too, to save a little more time and effort.
116s to 18s is a very decent >6x speed-up!
Coverage policy
Having matched previous synthesis behaviour exactly on existing data, I decided to tweak the policy a bit.
Previously, a missing value for a given date, once there had been any value seen for that data source, made coverage of the synthetic value "unknown".
Now I only make coverage "unknown" for a missing value with an operation other than +.
Also, low and unknown coverage items now get a meter/graph, but at low opacity to suggest reduced confidence, and with a title indicating the coverage status/level, eg this fragment:
| 2022-01 | 676 | ||
| 2022-02 | *441 | ||
| 2022-03 | 249 |
: Grid-Friendly Anti-Herding Dither
I inserted one (non-comment) line of code to dither the timing of the Eddi going into STOP mode and spilling all to grid (waiting randomly up to ~26s) at the start of a grid/SSES peak period when diverting. This reduces our contribution to big demand slews at (half-)hour boundaries, also known as 'herding', since unlike responding to low frequency or voltage, there is no huge hurry.
    if [ "H" = "$EXPGRIDDEMAND" ]; then
        # High (peak!) grid demand hours: spill to grid - do not divert/boost.

        # Grid-kind anti-herding: dither entering STOP mode up to 26s.
        sleep "$(awk 'BEGIN{srand(); print 1+int(25*rand());}')"

        echo "STOPPED $ISOUTCDATETIME ${GRD}W grid peak demand time" | tee -a "$STOPLOGFILE" 1>&2
        if [ "6" != "$STATUS" ]; then sh script/myenergi/eddiStop-netrc.sh 0; fi
        exit 1
    fi
For more dithering/smearing, where the Eddi is about to be unSTOPped, randomly half the time it now does not do so, ie stays in STOP mode, thus deferring resumption of diversion/boost for another minute. By extension this deferral may last multiple minutes, with an exponential probability decay. I do not expect to get to see this operate for several weeks at least!
    # If frequency OK and was paused, then unpause/resume.
    if [ "6" = "$STATUS" ]; then

        if [ 0 -eq "$(awk 'BEGIN{srand(); print (rand()<0.5);}')" ]; then
            # Grid-kind anti-herding: sometimes defer unSTOP to next minute.
            echo "STOPPED $ISOUTCDATETIME ${GRD}W deferred-unSTOP" | tee -a "$STOPLOGFILE" 1>&2
            exit 1
        fi

        # Grid-kind anti-herding: dither leaving STOP mode up to 26s.
        sleep "$(awk 'BEGIN{srand(); print 1+int(25*rand());}')"
        sh script/myenergi/eddiStop-netrc.sh 1
    fi
    # Frequency OK, not paused, doesn't need anything done.
    exit 0
: unSTOP
Pasteurisation ran in the early hours, and there was some unSTOP deferral! (40 minutes' low-frequency response in one morning is notably high.)
STOPPED 2026-01-30T02:02:01Z 1884W frequency low at 49.88Hz
STOPPED 2026-01-30T02:03:01Z 165W frequency low at 49.89Hz
STOPPED 2026-01-30T02:34:02Z 1870W frequency low at 49.89Hz
STOPPED 2026-01-30T02:35:01Z 159W frequency low at 49.89Hz
STOPPED 2026-01-30T02:36:02Z 162W frequency low at 49.89Hz
STOPPED 2026-01-30T02:37:01Z 84W frequency low at 49.89Hz
STOPPED 2026-01-30T02:38:02Z 91W frequency low at 49.88Hz
STOPPED 2026-01-30T02:39:02Z 85W frequency low at 49.88Hz
STOPPED 2026-01-30T02:40:01Z 79W frequency low at 49.84Hz
STOPPED 2026-01-30T02:41:02Z 84W frequency low at 49.85Hz
STOPPED 2026-01-30T02:42:01Z 1858W frequency low at 49.88Hz
STOPPED 2026-01-30T02:43:01Z 99W frequency low at 49.89Hz
STOPPED 2026-01-30T02:44:01Z 103W frequency low at 49.89Hz
STOPPED 2026-01-30T02:45:01Z 88W frequency low at 49.89Hz
STOPPED 2026-01-30T02:46:02Z 102W frequency low at 49.89Hz
STOPPED 2026-01-30T02:47:01Z 92W frequency low at 49.89Hz
STOPPED 2026-01-30T02:48:02Z 90W frequency low at 49.85Hz
STOPPED 2026-01-30T02:52:01Z 1883W frequency low at 49.88Hz
STOPPED 2026-01-30T02:53:01Z 91W frequency low at 49.89Hz
STOPPED 2026-01-30T02:54:02Z 90W frequency low at 49.85Hz
STOPPED 2026-01-30T02:55:01Z 105W frequency low at 49.89Hz
STOPPED 2026-01-30T02:56:02Z 82W frequency low at 49.89Hz
STOPPED 2026-01-30T02:57:01Z 108W frequency low at 49.89Hz
STOPPED 2026-01-30T02:58:02Z 87W deferred-unSTOP
STOPPED 2026-01-30T02:59:01Z 166W deferred-unSTOP
STOPPED 2026-01-30T03:38:01Z 1912W frequency low at 49.89Hz
STOPPED 2026-01-30T03:39:01Z 163W deferred-unSTOP
STOPPED 2026-01-30T03:40:03Z 162W frequency low at 49.89Hz
STOPPED 2026-01-30T03:41:02Z 166W frequency low at 49.89Hz
STOPPED 2026-01-30T04:04:01Z 193W frequency low at 49.88Hz
STOPPED 2026-01-30T04:05:01Z 159W frequency low at 49.89Hz
STOPPED 2026-01-30T04:06:02Z 148W frequency low at 49.82Hz
STOPPED 2026-01-30T04:07:01Z 153W frequency low at 49.89Hz
STOPPED 2026-01-30T04:08:02Z 90W frequency low at 49.89Hz
STOPPED 2026-01-30T04:09:01Z 91W frequency low at 49.89Hz
STOPPED 2026-01-30T04:10:01Z 103W frequency low at 49.89Hz
STOPPED 2026-01-30T04:11:02Z 84W frequency low at 49.89Hz
STOPPED 2026-01-30T04:12:02Z 109W frequency low at 49.89Hz
STOPPED 2026-01-30T04:13:02Z 91W deferred-unSTOP
STOPPED 2026-01-30T04:24:02Z 124W frequency low at 49.89Hz
: Cold Day Heat Pump Load Profile
Early days in have been quite cold, with high hph4 electricity demand.
#Eddi daily stats summary in kWh; partial if h lt 24
#UTCISOdate,h,h1d,h1b,imp,exp,h2d,h2b,hph4
2026-01-01,24,0,0,13.127,0.011,0,0,8.188
2026-01-02,24,0.008,0,11.512,0.024,0,0,8.723
2026-01-03,24,0,0,12.824,0.017,0,0,11.692
2026-01-04,24,0.005,0,17.148,0.053,0,0,11.606
2026-01-05,24,0.004,0,15.645,0.028,0,0,11.037
2026-01-06,24,0,0,15.612,0.007,0,0,10.885
2026-01-07,24,0,0,9.382,0.013,0,0,7.453
2026-01-08,24,0,0,12.985,0,0,0,6.686
2026-01-09,24,0,0,13.987,0.003,0,0,6.928
I am interested to see if the hph4 load profile for those days (eg –) is unusual in any way. 
hph4 (heat pump) and net grid flows for to inclusive generated with sh script/storesim/load_profile.sh -hph4 202601-03to06-part. Times UTC. Data and other views are available.
Beyond the morning DHW and space-heating peak looking big, and a mean daytime hph4 demand of ~500W being most (grid) load, and the grid evening peak-time heat-pump demand not being clearly suppressed, nothing leaps out yet...
: Two Historic Data Glitches and Correction

There have long been improbably-high data points in the grid-tie generation at data/WW-PV-roof/E2023.csv, easily seen in the graph snapshot, that I think arose from loss of data for a day or so, and then over-correction / catch-up.
...
21/05/2023,17.300
22/05/2023,13.240
23/05/2023,20.820
24/05/2023,0.000
25/05/2023,15.640
26/05/2023,43.710
27/05/2023,28.290
28/05/2023,27.660
29/05/2023,27.540
30/05/2023,23.650
...
01/08/2023,13.130
02/08/2023,10.460
03/08/2023,11.950
04/08/2023,10.590
05/08/2023,9.040
06/08/2023,14.520
07/08/2023,37.620
08/08/2023,6.720
09/08/2023,24.350
10/08/2023,21.850
...
For one of these I have a note for : the (rechargeable) batteries inside the SunnyBeam appear to be dead
. The data points above are collected via the SunnyBeam.
There is also high-precision data available from the Enphase for generation, which might be used to re-bucket the reported generation, maintaining the total across the few days centred on the false high.
When I have made corrections in the past I have deliberately reduced precision of the value to leave a human-visible artefact of the adjustment. This does not hurt the data processing of those records. Also, the repository change tracking records the adjustment.
% egrep '[.][0-9]$' data/WW-PV-roof/E????.csv
data/WW-PV-roof/E2022.csv:07/02/2022,4.6
data/WW-PV-roof/E2022.csv:08/02/2022,2.0
data/WW-PV-roof/E2023.csv:12/05/2023,8.5
data/WW-PV-roof/E2023.csv:13/05/2023,9.2
data/WW-PV-roof/E2023.csv:14/05/2023,20.0
data/WW-PV-roof/E2023.csv:15/05/2023,20.3
data/WW-PV-roof/E2024.csv:08/08/2024,12.0
I could manually extract Enphase data for the appropriate dates by hand, or in a spreadsheet (it is in CSV form), or with a one-off script. Or I could add a script to my consolidated energy stats to extract this daily data to make the Enphase another daily data source for the gen data time series. (It already is a monthly source.) This has the advantage of making this alternate fine-grain data more easily accessible.
Having done that, the corresponding part of the daily gen data data/consolidated/energy/std/gen/D/gen-D.csv is:
...
2023-05-21,Enphase,1,17.607,SunnyBeam,1,17.300
2023-05-22,Enphase,1,13.558,SunnyBeam,1,13.240
2023-05-23,Enphase,1,21.157,SunnyBeam,1,20.820
2023-05-24,Enphase,1,25.711,SunnyBeam,1,0.000
2023-05-25,Enphase,1,18.974,SunnyBeam,1,15.640
2023-05-26,Enphase,1,28.333,SunnyBeam,1,43.710
2023-05-27,Enphase,1,28.555,SunnyBeam,1,28.290
2023-05-28,Enphase,1,27.910,SunnyBeam,1,27.660
2023-05-29,Enphase,1,27.807,SunnyBeam,1,27.540
2023-05-30,Enphase,1,23.906,SunnyBeam,1,23.650
...
2023-08-01,Enphase,1,15.842,SunnyBeam,1,13.130
2023-08-02,Enphase,1,12.672,SunnyBeam,1,10.460
2023-08-03,Enphase,1,15.295,SunnyBeam,1,11.950
2023-08-04,Enphase,1,11.855,SunnyBeam,1,10.590
2023-08-05,Enphase,1,9.762,SunnyBeam,1,9.040
2023-08-06,Enphase,1,18.138,SunnyBeam,1,14.520
2023-08-07,Enphase,1,23.352,SunnyBeam,1,37.620
2023-08-08,Enphase,1,7.021,SunnyBeam,1,6.720
2023-08-09,Enphase,1,24.550,SunnyBeam,1,24.350
2023-08-10,Enphase,1,22.043,SunnyBeam,1,21.850
...
Generally the SunnyBeam seems to slightly under-report gen compared to the calibrated supply/generation meters, and the Enphase slightly over-reports.
So the Enphase values should probably be used to shape the redistribution of existing SunnyBeam numbers, in the bold rows (3 in each case), rather than being used directly.
For the first block of 3 days, centred on , the Enphase sum is 73.018kWh split ~35%/26%/39%. For those days the SunnyBeam sum is 59.350kW split ~0%/26%/74%.
The big gap in the kWh values between Enphase and SunnyBoy suggests some generation not recorded at all in the SunnyBoy side, but that will not be resolved here.
Rebucketing the SunnyBoy numbers with the Enphase percentages gives (rounded to 1dp to show the manual adjustment) 20.9kWh / 15.4kWh / 23.0 kWh.
For the second block of 3 days, centred on , the Enphase sum is 48.511kWh split ~37%/48%/14%. For those days the SunnyBeam sum is 58.860kW split ~25%/64%/11%.
The gap in kWh sums is less explicable, and again will not be resolved here.
Rebucketing the SunnyBoy numbers with the Enphase percentages gives (rounded to 1dp to show the manual adjustment) 22.0kWh / 28.3kWh / 8.5 kWh.
Before adjusting the data I took a snapshot copy:
% svn cp data/WW-PV-roof/E2023.csv data/WW-PV-roof/20260107-preadjustment-E2023.csv
The diff to be applied as seen by svn is:
Index: data/WW-PV-roof/E2023.csv
===================================================================
--- data/WW-PV-roof/E2023.csv	(revision 65648)
+++ data/WW-PV-roof/E2023.csv	(working copy)
@@ -141,9 +141,9 @@
 21/05/2023,17.300
 22/05/2023,13.240
 23/05/2023,20.820
-24/05/2023,0.000
-25/05/2023,15.640
-26/05/2023,43.710
+24/05/2023,20.9
+25/05/2023,15.4
+26/05/2023,23.0
 27/05/2023,28.290
 28/05/2023,27.660
 29/05/2023,27.540
@@ -215,9 +215,9 @@
 03/08/2023,11.950
 04/08/2023,10.590
 05/08/2023,9.040
-06/08/2023,14.520
-07/08/2023,37.620
-08/08/2023,6.720
+06/08/2023,22.0
+07/08/2023,28.3
+08/08/2023,8.5
 09/08/2023,24.350
 10/08/2023,21.850
 11/08/2023,17.570

li date
I have slightly extended the code that automatically wraps time tags around a leading date in a list item (li) to work also when attributes such as id are present.
As this forces a full site rebuild, and fixes only about 7 items across 2 articles, I have taken this opportunity to trim a little AMP-related cruft in passing.
: rel
Given there has not been enough sun today to force a full rebuild yet, I have also taken the opportunity to add rel=privacy-policy and rel=author to relevant boiler-plate in the page template.
The HTML validator is not allowing rel=license in the places that I think it should go, appended to link href=about-us.html#License itemprop=acquireLicensePage, so that remains pending.
: Energy Series Refresh
The energy series were updated to better match the names used for the energy profiles.
New eheat (electric heat: diversion, boost and heat-pump) and iheat (immersion heat: diversion and boost) time series were added. These are the electricity inputs and cover all DHW and space heat. The old immDHW, equivalent to iheat, was retired.
Efficiency tweaks
In line with Less DHW from Diversion this Summer I updated the frequency-response script to avoid diversion during SSES peaks, and raised the Eddi Export Margin (and Export Threshold). Effects may start to be seen in March.
Archive goodness
Year-end archives pushed out to Zenodo:
- Earth.Org.UK (EOU) public data snapshot including home energy timeseries.
- Earth.Org.UK (EOU) main pages offline archive.
I do not think that the main-page archive HTML is linking to the images that are in the archive, ie is still linking to the EOU images online, so that may need fixing. At least all the key data is probably there.
: More DHW Tweaks
I extended the heat battery and pasteurisation control system notion of winter from Nov/Dec/Jan to include Feb also, and not to defer an early morning boost in winter when the day is forecast to be sunny since that will likely not be sunny enough for full pasteurisation by diversion!
Silly macOS mail client chatter
Mainly for the record, ie my memory, I am recording here that my entire Internet performance from DNS upwards appeared to be impacted by a very very silly amount of chatter between my macOS Apple email client and the Microsoft Exchange server for the University of Surrey. I turned some features off entirely and shut down the mail client overnight... After a bit more silliness in the morning maybe it was behaving itself again.
Well, maybe not. A sample the next evening with:
% tcpdump port https and host 52.97.X.X
indicates about 300 packets per second...
: not bufferbloat
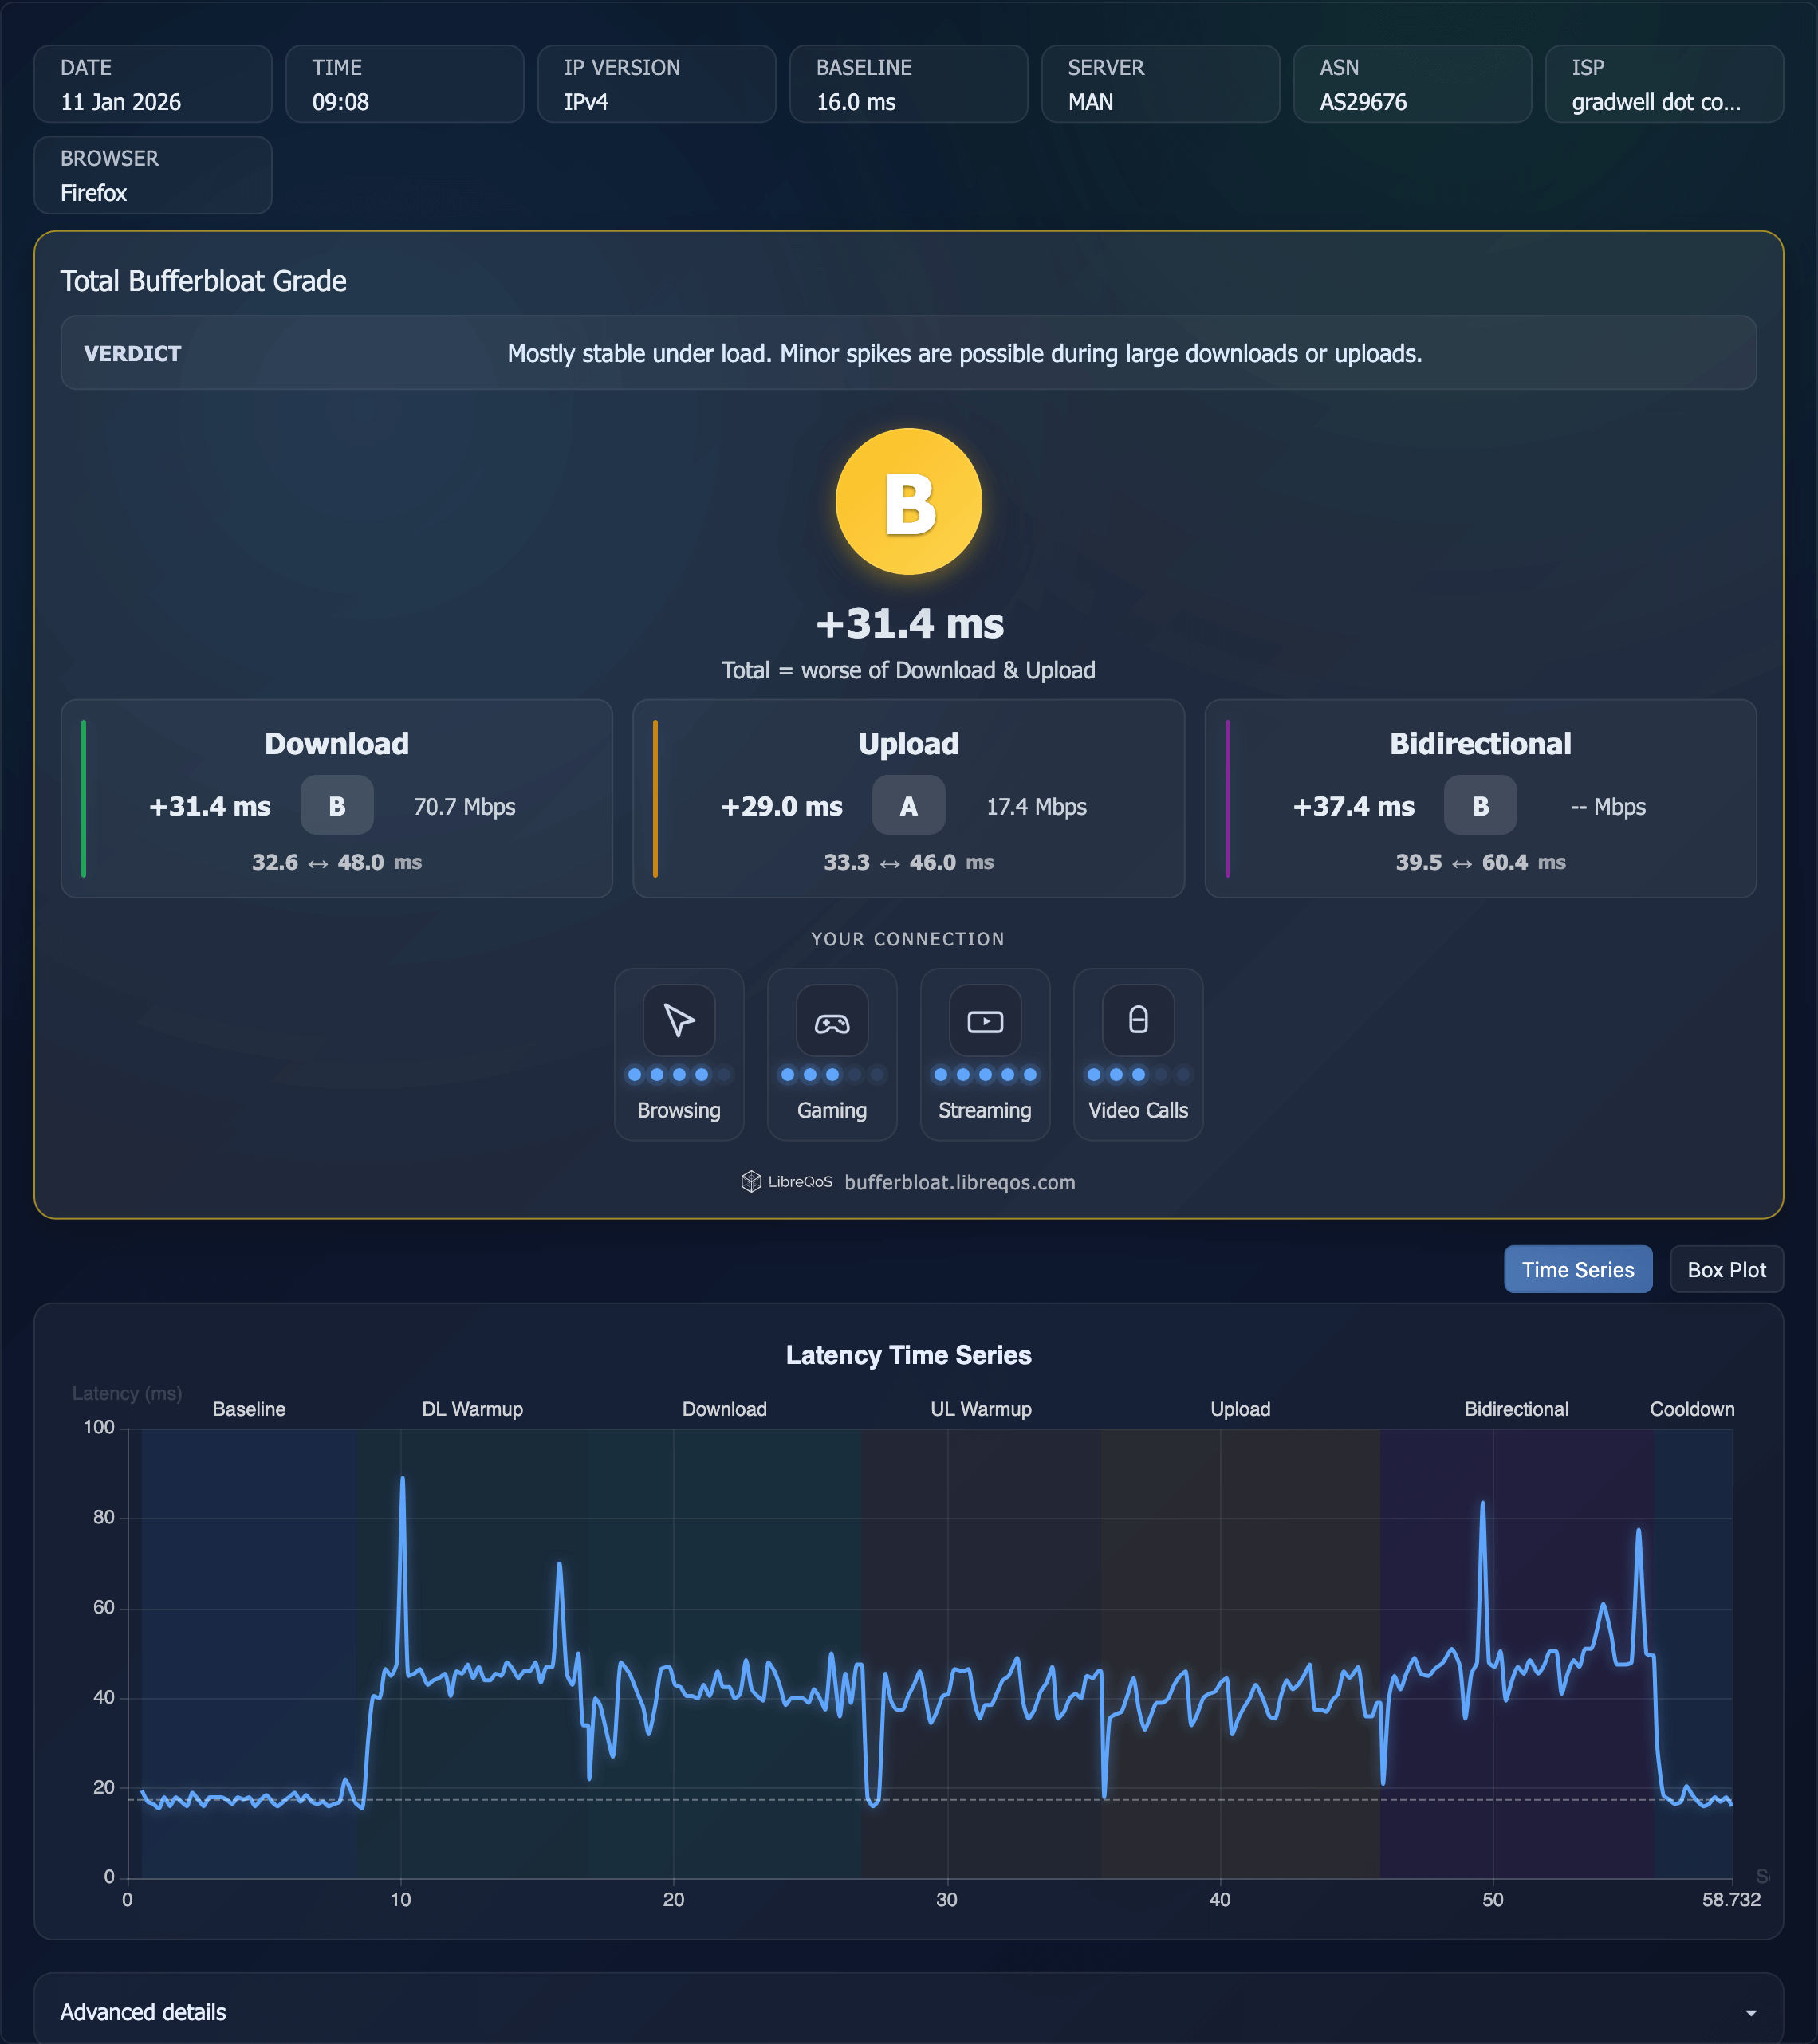
A subsequent Bufferbloat Test at scoring B +31.4ms from my MBA over 5G WiFi at 16WW, suggests that bufferbloat was not part of the slowness that I had noticed.