Earth Notes: Saving Electricity and Gas (2012)
Updated 2026-03-29.Meter readings at home.

We became a 'SuperHome' with nominal carbon savings of 62%.
data (kWh: e used 1542, e gen -3778, g 3707).
See the daily PV generation logs for 2012 as .csv and .png chart.
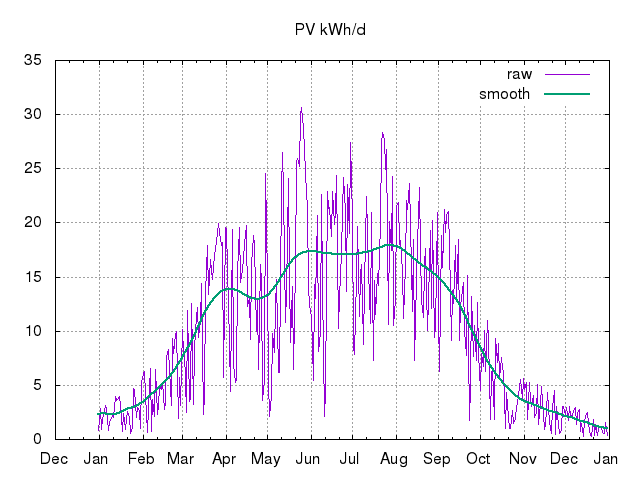
See five winters' worth of improving energy efficiency, noting that winter 2011--2012 was very mild. A crude analysis of exported iMeasure data as at 2012-08-08 indicates that computed baseline (kWh/d) and slope ((kWh/d)/(HDD12/d)) for each year have been (roughly in line with previous estimates):
| Year | Baseline (kWh/d) | Slope ((kWh/d)/(HDD12/d)) | year kWh | year HDD12 |
|---|---|---|---|---|
| 2007p | 13.84 | 4.09 | ||
| 2008 | 9.32 | 4.14 | 8883 | 1061 |
| 2009 | 6.02 | 3.11 | 6201 | 1068 |
| 2010 | 3.19 | 3.10 | 5784 | 1481 |
| 2011 | 4.08 | 2.87 | 3936 | 820 |
| 2012p | 3.05 | 2.35 | ||
We became a 'SuperHome' (number 119) early in 2012. We have nominal carbon savings (ignoring our PV) of 62%.
| 2012 | Electricity | Gas | |||
|---|---|---|---|---|---|
| Month | Consumed kWh (/d) | Generated -kWh (/d) | Consumed kWh (/d) | Period | Notes |
| 2012-01 | 174 (5.6/d) | -75 (-2.4/d) | 669 (22/d) | 20111231T18:12Z to 20120131T18:42Z (31d) | Meter readings: electricity generation 75.3kWh, export 47.1kWh, import 145.6kWh (thus net consumption (I+G-E) 158.8kWh); gas ~60.3m^3 (so 669kWh @ 11.1kWh/m^3). Electricity target missed for month with dehumidifier on a lot to try to keep below 70%RH in the kitchen especially when laundry drying. Gas target missed (592kWh@169HDD for central heating) also, at ~3.1kWh/HDD, possibly also because of different attempts to keep humidity in check. HDD12=169 vs 215 last January. (Compare with January 2008: HDD12=140, gas 1418kWh, electricity 214kWh.) |
| 2012-02 | 153 (5.3/d) | -148 (-5.1/d) | 653 (23/d) | 20120131T18:42Z to 20120229T18:11Z (29d) | Meter readings: electricity generation 148.2kWh, export 113.3kWh, import 117.7kWh (thus net consumption (I+G-E) 152.6kWh); gas ~58.8m^3 (so 653kWh @ 11.1kWh/m^3). Electricity (t:153kWh) missed and gas (t:549kWh CH) hit target for month. Was still using dehumidifier a little to control RH. HDD12=211 vs 132 last February. |
| 2012-03 | 139 (4.5/d) | -371 (-12/d) | 328 (11/d) | 20120229T18:11Z to 20120331T17:18Z (31d) | Meter readings: electricity generation 370.6kWh, export 370.6kWh, import 96.1kWh (thus net consumption (I+G-E) 139.3kWh); gas ~29.5m^3 (so 238kWh @ 11.1kWh/m^3). Electricity and gas targets met for month. From second week of March had MHRV off and windows open selectively, moved ADSL off-grid. Near end of month passed 10MWh on first generation meter, and turned central heating off. HDD12=109 vs 146 last March; this one was third warmest on record. |
| 2012-04 | 117 (3.9/d) | -409 (-14/d) | 147 (4.9/d) | 20120331T17:18Z to 20120430T17:01Z (30d) | Meter readings: electricity generation 408.9kWh, export 362.9kWh, import 70.9kWh (thus net consumption (I+G-E) 116.9kWh); gas ~13.3m^3 (so 147kWh @ 11.1kWh/m^3). Electricity and gas targets met for month. I believe that the MHRV has probably helped with gas/heating in particular by helping us trap heat when available. Passed 12MWh generation total according to (slightly conservative) Sunny Beam. HDD12=108 vs 33 last April and 82 in April 2010; this April was wettest for over 100 years and very gloomy at times. |
| 2012-05 | 128 (4.1/d) | -524 (-17/d) | 174 (5.6/d) | 20120430T17:01Z to 20120531T21:15Z (31d) | Meter readings: electricity generation 524.0kWh, export 460.0kWh, import 64.0kWh (thus net consumption (I+G-E) 128.0kWh); gas ~15.7m^3 (so 174kWh @ 11.1kWh/m^3). Electricity and gas targets met for month. Passed 8MWh exports. HDD12=42 vs 24 last May and 66 in May 2010. |
| 2012-06 | 103 (3.4/d) | -507 (-17/d) | 148 (4.9/d) | 20120531T21:15Z to 20120630T18:23Z (30d) | Meter readings: electricity generation 507.6kWh, export 443.6kWh, import 39.3kWh (thus net consumption (I+G-E) 103.2kWh); gas ~13.3m^3 (so 148kWh @ 11.1kWh/m^3). Electricity and gas targets met for month. Experimentally we are running appliances in the day to better match generation, although it probably does not minimise carbon footprint (vs the wee hours), and imports this month were ~39kWh compared to ~61kWh last June, so in the summer months there are some real options with load shifting. Generation probably low in part because April to June this year has been the wettest second quarter in the UK since records began in 1910 and June was the second dullest recorded. HDD12=7 vs 10 last June and 8 in June 2010. |
| 2012-07 | 99 (3.2/d) | -534 (-17/d) | 126 (4.1/d) | 20120630T18:23Z to 20120731T17:12Z (31d) | Meter readings: electricity generation 534.4kWh, export 470.9kWh, import 35.3kWh (thus net consumption (I+G-E) 98.8kWh); gas ~11.4m^3 (so 125kWh @ 11.1kWh/m^3). Electricity and gas targets met for month. We continued running appliances/loads to match PV generation, even though the generally poor sunshine and unpredictable showers/cloud made that hard (oh for smart appliances / HAN / smart meters!). We were away on holiday the last week of July, thus low consumption figures. HDD12=1 vs 1 last July and 0 in July 2010. |
| 2012-08 | 93 (3.0/d) | -514 (-17/d) | 101 (3.3/d) | 20120731T17:12Z to 20120831T17:40Z (31d) | Meter readings: electricity generation 513.5kWh, export 457.5kWh, import 37.2kWh (thus net consumption (I+G-E) 93.2kWh); gas ~9.1m^3 (so 101kWh @ 11.1kWh/m^3). Electricity and gas targets met for month. We continued running appliances/loads to match PV generation; next month we switch back to make the effect on imports clear in the monthly stats. Most of the family was still away on holiday at the start of this month, and there other short breaks from home, thus low consumption figures. This was probably the second-wettest summer on record. It was chilly enough on the night of the 30th for condensation on the insides of the kids' (old 2G) windows at ~8°C. HDD12=2 vs 2 last August and 4 in August 2010. |
| 2012-09 | 126 (4.2/d) | -391 (-13/d) | 165 (3.3/d) | 20120831T17:40Z to 20120930T16:55Z (30d) | Meter readings: electricity generation 391.3kWh, export 341.8kWh, import 76.4kWh (thus net consumption (I+G-E) 125.9kWh); gas ~14.8m^3 (so 165kWh @ 11.1kWh/m^3). Electricity target just missed, gas target met for month. This month we switched back to running washing machine and dishwasher at night to minimise carbon footprint rather than our bills (first dishwasher run in early hours of 1st Sept, though ran dishwasher maintenance hot wash during gloriously-sunny 9th) to make the effect on imports (doubling!) clear in the monthly stats. We had some dew outside our new triple glazing, which shows it working. HDD12=17 vs 6 last September and 19 in September 2010. |
| 2012-10 | 119 (3.8/d) | -164 (-5.2/d) | 152 (4.9/d) | 20120930T16:55Z to 20121031T18:00Z (31d) | Meter readings: electricity generation 164.1kWh, export 135.3kWh, import 90.3kWh (thus net consumption (I+G-E) 119.1kWh); gas ~13.7m^3 (so 152kWh @ 11.1kWh/m^3). Electricity and gas targets met for month. ADSL/broadband modem went back on-grid 5th Oct when off-grid battery getting low and not much sunshine was forecast. Energy bills before Big 6 rises announced predicted cost for next 12 months at current rates of ~£190 for electricity (1.0MWh) and ~£250 for gas (3.4MWh). Central heating not on yet! Dehumidifier run from time to time when RH above 70% (on ~4 days). Was in DECC smart heating workshop! HDD12=55 vs 31 last October and 62 in October 2010. |
| 2012-11 | 149 (5.0/d) | -90 (-3.0/d) | 366 (12/d) | 20121031T18:00Z to 20121130T18:03Z (30d) | Meter readings: electricity generation 90.0kWh, export 61.6kWh, import 120.7kWh (thus net consumption (I+G-E) 149.1kWh); gas ~33.0m^3 (so 366kWh @ 11.1kWh/m^3). Electricity and gas targets met for month. Heating on 2012-11-06 18:15 after about 6 HDD12 each day since start of month. Total gas consumption about same as last November though much colder this. One day no electricity at all was exported to the grid (and we imported 5.3kWh). Kitchen MHRV installed 2012-11-26 (and test electronic TRV smart heating 2012-12-15 in one bedroom); significant dehumidifier use until then, including ~10l water removed in one day! HDD12=133 vs 66 (347kWh gas use) last November and 185 (654kWh gas use) in November 2010. |
| 2012-12 | 142 (4.6/d) | -50 (-1.6/d) | 677 (22/d) | 20121130T18:03Z to 20121231T18:41Z (31d) | Meter readings: electricity generation 49.9kWh, export 29.5kWh, import 121.8kWh (thus net consumption (I+G-E) 142.2kWh); gas ~61.0m^3 (so 677kWh @ 11.1kWh/m^3). Electricity target met, gas target missed (by ~4%). (I think that we ran over in part because I spent far too much of three weeks in bed with colds/flu/whatever, with the heating up; and also because I stayed home at no point was the place entirely empty.) Failed CRT TV replaced with lower-power larger-screen LED-backlit LCD model. On 4 days no significant electricity was exported to the grid. (The off-grid system was straining in the gloom but still coping.) A detailed analysis of energy by day shows, for example: a max gas consumption of 40kWh on one day, an apparent baseline of 9.2kWh/d and slope of 2.1kW/HDD12 for gas, and an almost complete lack of correlation between electricity and HDD. I also compute what electricity imports would be if gas heating were replaced with various CoPs of heat-pump, ignoring cooking. HDD12=190 vs 154 last December and 328 for 2010; a fairly mild winter so far. |
| 2012 total (Jan–Dec) | 1542 (4.21/d) | -3778 (-10.3/d) | 3707 (10.1/d) | 20111231T18:12Z to 20121231T18:41Z (366d) | Electricity import (1015kWh) marginally down from 2011 (1081kWh) with consumption (1542kWh) back close to 2010 (1554kWh). Average 176W gross. Generation (3778kWh) sightly down to very close to PVGIS predictions (from 3988kWh). Gas consumption down about 6% (to 3707kWh, vs 3936kWh in 2011) even though HDD12 up ~25% (1043, vs 820 in 2011), ie the year was colder. Very similar final carbon-negative position to last year. (The utility bills came in dated 2013-01-02 stating gas consumption of 3474kWh over the last 12 months and electricity imports of 998kWh, from agent reads, so my figures are slightly conservative but close, with predicted costs at same rates for next 12 months £238 and £202 respectively.) |
| kgCO2 | 663kg (1.8/d) | -1625kg (-4.4/d) | 710kg (2.0/d) | ~-0.26tCO2 (~-0.70kgCO2/d) gas/electricity emissions total for 4 people, based on 0.43kgCO2/kWh for electricity (netted) and 0.19kgCO2/kWh for gas, ie slightly carbon negative. Note that we have not flown this year again, we still do not own a car and travel almost entirely by (usually-electrified) public transport. | |