Earth Notes: Saving Electricity and Gas (2019)
Updated 2026-03-29.
data (kWh: e used 1992, e gen -3855, g 3157).
Off-grid 66.6kWh captured by primary (MPPT) solar controller.
See the daily PV generation logs for 2019 as .csv and .png chart.
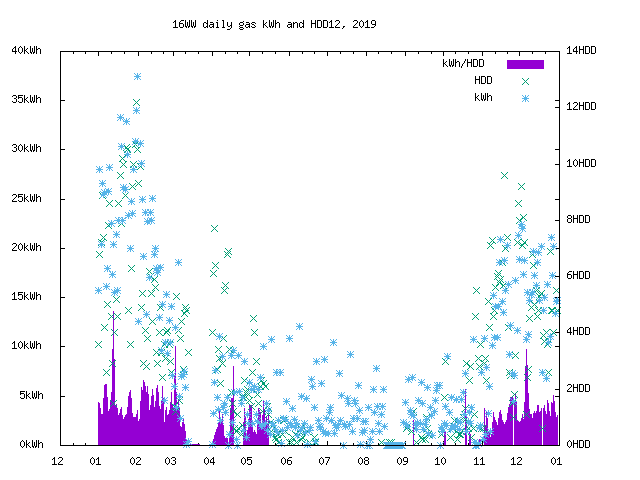
See gas use kWh and heating degree days (HDD) by time for 2019 as .csv and .png chart.

See gas kWh vs heating degree days (HDD) regression for 2019 as .png chart.

: Energy charges
From 1st October our energy charges are 20.79p/kWh (e) and 4.8825p/kWh (g), with the standing charge on each being a little over 29p/d each ie ~£220/y total. That puts up our total bill about £42/y from ~£540/y.
: Diversion vs standing charge
The gas standing charge would buy ~530kWh of electricity.
If PV diversion could save ~810kWh/y, from 2018's 3980kWh gas, nominally 2640kWh electricity would need to be bought for resistive heat for additional £549 (-~£150 currently spent on gas over standing charge), but actual may be lower given gas much less than 100% efficient, indeed the 'extra' may be close to zero.
: unLooped
Discovered that Loop readings have not been coming through since 22nd (gas) / 25th September (electricity). Unplugged and replugged Ethernet cable for Loop RX and data started flowing and catching up. While catching up (~14:17Z) as reading shown in Loop 3486.14 and on meter 3519.75. (All of September's data was caught up by 2019-10-08T07:00Z.)
2019-10-07T18:30Z: I note that the Loop electricity transmitter stopped reporting after about an hour with very little grid electricity flow (because the Enphase was covering demand, to within ~5W or less). When the microwave had been on for less than a minute (more than the Enphase could cover) then data stated flowing again, suggesting that the Loop electricity transmitter is largely parasitically powered. The Loop can't seem to measure less than ~70W, so may not be able to run off much less either.
2019-10-08: Loop readings have all caught up (impressive recovery)! There is still a big difference between the gas reading on the dial and what Loop thinks it is, possibly from the known month (ish) outage. Loop's virtual meter reads 3490.96 as of 07:17Z, the real meter 3520.36. I have updated Loop to reflect reality.
2019-12-30T18:15Z: Loop reports 3599.71 gas vs actual visible meter reading of 3599.70 (m^3), so decent tracking.
: 5kWp PV vs 500kWh store
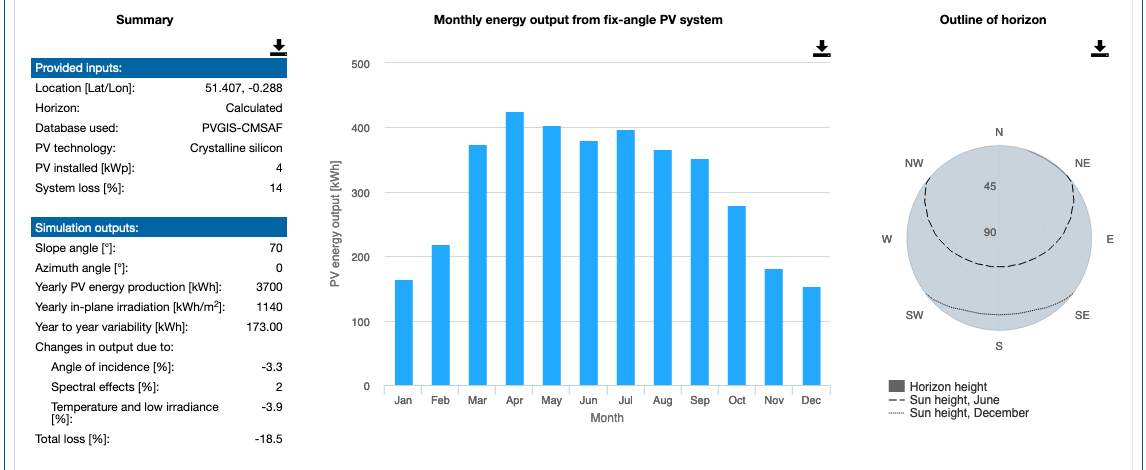
PVGIS suggests that an additional 5kWp (south-facing) at 35° (or maybe 4kWp at 70°) of PV would supply ~5kWh/d in December, so would cover house electrical loads when used alongside the current 5kWp even mid-winter. That would need storage (I would not be allowed to connect it to the grid and/or I'd want to cover poor-solar days) and planning permission (it would cover our garden) and some social licence. That could get us off the electricity grid, or to be export only. Wind&Sun has such a 5kWp off-grid kit for ~£10k for example, which is more than an order of magnitude cheaper than interseasonal storage of appropriate magnitude (300--500kWh). That new 5kWp does not cover space-heat demand at all in December, maybe partly outside December. We would not be able to export excess power without a special arrangement. But we only need kWhs not 100s of kWhs of storage, and maybe a month or two's heat storage (electrically charged) could cover space heat!
: Simulating ToU load shaping
As we move into winter (and low solar generation) I have been fiddling with the Enphase AC Battery, simulating ToU (Time of Use) charging and load shaping. Rather less successfully I tried topping up in the wee hours with a night charge but the behaviour was very poor from my point of view!
: Test Boiler Fire-up


At about 3pm (14:00Z) I brought the boiler controller into sync with the latest Radbots and test fired the boiler. Water pressure was a little low so I topped it up. I then let the boiler run for about 10 minutes until the flame cut because the return temperature was high enough. (~2kWh of gas burnt according to Loop.) Everything seems to be working.
Though about half of the Radbots were calling for heat, we were comfortable without the heating running. (We haven't had the heating on yet, and we usually try to do without until November.) This has prompted me to turn all the Radbots down one click (1°C) from where they were, mainly to 2 or 2.5 (17°C or 18°C), though 1.5 in the hall (16°C) and 3 in the living room (19°C). We may be happy at these lower temperatures and could earn a ~10% saving in space-heat demand if so.
: Heat On

Last night external temperatures were down to about freezing, but we managed without having had the heating on yet. Internal temperatures got down to a mean of ~15°C.
From today, the heating is on, set to run from ~06:30* to ~16:00, and ~19:00 to ~22:00. The early-evening gap is intended to simulate running an on-demand electric-based heating system that avoids drawing power during that peak period. The system could be pure resistive or a heat-pump, and might have storage or not. In any case, avoiding power to run the boiler during peak hours (eg fan and pump), is still helpful to the grid(s).
There are now three systems to reduce our imports in the peak 4--7pm slot: diversion of some load off-grid (~4W max currently!), avoiding the central heating boiler running (~170W max), and the Enphase AC Battery hoarding charge on weekdays until 4pm (~270W max).
* For this first Sunday morning I put off fire-up by an hour, to avoid having the entire house heave into life early! It actually fired up ~07:45 and burned ~5kW in the 8am Loop slot and ~2kWh in the 9am slot. After ~45 minutes Radbots were off. (There was a little DHW use also, and note that a subsequent shower took another ~2kWh+ in the 11am slot.)
At 19:12 the peak-time off-period was restraining the boiler from firing up, ie a couple of valves had just opened and the boiler would otherwise have started a few minutes sooner. Some simple grid support delivered!
(Straw poll on Twitter followers' heating status...)
2019-11-11: this morning boost was pressed in the kitchen as some extra warmth was requested; the room was not cold enough to call for heat. This afternoon the boiler controller tried to fire up the boiler at around 16:20, as two of the valves called for heat, probably as a result of my daughter coming home. So we'll have to see if anyone minds nothing happening until after 7!
: Hand Dishwash
Gas use for the 6pm--7pm slot on Loop was shown as 0.56kWh, which was one small hand wash of kitchen utensils. Against which, 0.8kWh electricity for our dishwasher's ECO (50°C) program for more than a day's dishes and cutlery and cups/glasses seems a reasonable deal, especially when grid carbon intensity is low.
| 2019 | Electricity | Gas | |||
|---|---|---|---|---|---|
| Month | Consumed kWh (/d) | Generated -kWh (/d) | Consumed kWh (/d) | Period | Notes |
| 2019-01 | 198 (6.4/d) | -72 (-2.3/d) | 748 (24/d) | 20191231T18:02Z to 20190131T18:09Z (31d) | Meter readings: electricity generation 72.4kWh, export 17.5kWh, import 142.8kWh (thus net consumption (I+G-E) 197.7kWh, self consumption ((N-I)/N) 28%); gas ~67.4m^3 (so 748kWh @ 11.1kWh/m^3). Electricity imports down to 143kWh from 187kWh last January (4.6kWh/d down from 6.0kWh/d), and self-consumption up from 12% to 28%. HDD12=218 vs 166 last January. |
| 2019-02 | 164 (5.9/d) | -162 (-5.8/d) | 519 (19/d) | 20190131T18:09Z to 20190228T20:09Z (28d) | Meter readings: electricity generation 162.3kWh, export 92.2kWh, import 94.2kWh (thus net consumption (I+G-E) 164.3kWh, self consumption ((N-I)/N) 43%); gas ~46.8m^3 (so 519kWh @ 11.1kWh/m^3). Electricity imports down to 94kWh from 144kWh last February (3.3kWh/d down from 5.1kWh/d), and self-consumption up from 23% to 43%. HDD12=132 vs 237 last February. |
| 2019-03 | 196 (6.3/d) | -281 (-9.1/d) | 344 (11/d) | 20190228T20:09Z to 20190331T17:22Z (31d) | Meter readings: electricity generation 281.4kWh, export 176.8kWh, import 91.8kWh (thus net consumption (I+G-E) 196.4kWh, self consumption ((N-I)/N) 53%); gas ~31.0m^3 (so 344kWh @ 11.1kWh/m^3). Electricity imports down to 92kWh from 141kWh last March (3.0kWh/d down from 4.5kWh/d), and self-consumption up from 26% to 53%. HDD12=89 vs 185 last March. |
| 2019-04 | 150 (5.0/d) | -450 (-15/d) | 138 (4.6/d) | 20190331T17:22Z to 20190430T17:04Z (30d) | Meter readings: electricity generation 449.5kWh, export 345.5kWh, import 45.9kWh (thus net consumption (I+G-E) 149.9kWh, self consumption ((N-I)/N) 69%); gas ~12.4m^3 (so 138kWh @ 11.1kWh/m^3). Passed 30MWh generation on the first meter (first 3/4 of the PV). (Note that early in May 30MWh in exports is then passed.) Electricity imports down to 47kWh from 88kWh last April (1.5kWh/d down from 2.9kWh/d), and self-consumption up from 6% to 69%. HDD12=89 vs 64 last April. |
| 2019-05 | 171 (5.5/d) | -562 (-18/d) | 120 (3.9/d) | 20190430T17:04Z to 20190531T17:04Z (31d) | Meter readings: electricity generation 561.6kWh, export 433.2kWh, import 42.8kWh (thus net consumption (I+G-E) 171.2kWh, self consumption ((N-I)/N) 75%); gas ~10.8m^3 (so 120kWh @ 11.1kWh/m^3). Passed 9MWh generation on the second meter (last 1/4 of the PV). 30MWh in exports was passed. Electricity imports down to 43kWh from 66kWh last May (1.4kWh/d down from 2.1kWh/d), and self-consumption up from 59% to 75%. HDD12=39 vs 23 last May. |
| 2019-06 | 161 (5.4/d) | -542 (-18/d) | 108 (3.5/d) | 20190531T17:04Z to 20190630T17:15Z (30d) | Meter readings: electricity generation 542.1kWh, export 420.1kWh, import 39.8kWh (thus net consumption (I+G-E) 161.4kWh, self consumption ((N-I)/N) 75%); gas ~9.7m^3 (so 108kWh @ 11.1kWh/m^3). Electricity imports down to 40kWh from 56kWh last June (1.3kWh/d down from 1.9kWh/d), and self-consumption up from 59% to 75% (as for May!). HDD12=4 vs 2 last June. |
| 2019-07 | 150 (4.8/d) | -594 (-19/d) | 102 (3.3/d) | 20190630T17:15Z to 20190731T17:26Z (31d) | Meter readings: electricity generation 593.6kWh, export 474.2kWh, import 30.7kWh (thus net consumption (I+G-E) 150.1kWh, self consumption ((N-I)/N) 80%); gas ~9.2m^3 (so 102kWh @ 11.1kWh/m^3). Electricity imports down to 31kWh from 55kWh last July (1.0kWh/d down from 1.8kWh/d), and self-consumption up from 60% to 80%. HDD12=0 vs 0 last July. |
| 2019-08 | 100 (3.2/d) | -527 (-17/d) | 48 (1.5/d) | 20190731T17:26Z to 20190831T18:15Z (31d) | Meter readings: electricity generation 527.3kWh, export 445.1kWh, import 17.9kWh (thus net consumption (I+G-E) 100.1kWh, self consumption ((N-I)/N) 82%); gas ~4.3m^3 (so 48kWh @ 11.1kWh/m^3). Electricity imports down to 18kWh from 30kWh last August (0.6kWh/d down from 1.0kWh/d), and self-consumption up from 70% to 82%. Imports while away on holiday for ~14 days ~1.7kWh ie ~120Wh/d or ~5W (which is the Enphase import threshold). Imports this year are down 34% so far. Gross consumption was ~1.9kWh/d vs ~1.6kWh/d in the same period last year. That may be ~13W between the new router, and two extra RPi3s running on-grid for test and monitoring purposes. The router is moving to being partially powered off-grid 2019-09-03 (consumption ~250Wh/d). HDD12=0 vs 3 last August. |
| 2019-09 | 172 (5.7/d) | -367 (-12/d) | 106 (3.5/d) | 20190831T18:15Z to 20190930T17:17Z (30d) | Meter readings: electricity generation 357.4kWh, export 237.8kWh, import 52.4kWh (thus net consumption (I+G-E) 172.0kWh, self consumption ((N-I)/N) 70%); gas ~9.6m^3 (so 106kWh @ 11.1kWh/m^3). HDD12=6 vs 20 last September. |
| 2019-10 | 173 (5.6/d) | -169 (-5.4/d) | 94 (3.0/d) | 20190930T17:17Z to 20191031T18:15Z (31d) | Meter readings: electricity generation 168.7kWh, export 90.3kWh, import 94.3kWh (thus net consumption (I+G-E) 172.7kWh, self consumption ((N-I)/N) 45%); gas ~8.4m^3 (so 94kWh @ 11.1kWh/m^3). Oct 13 noon-ish switched Enphase into ToU mode, with 4pm to 7pm being 2.5x cost per kWh for remaining 21h. I expect a slight drop in self-consumption but also a slight increase in grid-friendliness overall. HDD12=42 vs 60 last October. |
| 2019-11 | 187 (6.2/d) | -81 (-2.7/d) | 338 (11/d) | 20191031T18:15Z to 20191130T18:17Z (30d) | Meter readings: electricity generation 80.8kWh, export 24.3kWh, import 130.4kWh (thus net consumption (I+G-E) 186.9kWh, self consumption ((N-I)/N) 30%); gas ~30.5m^3 (so 228kWh @ 11.1kWh/m^3). Putting off the first day we had the heating on (the 10th), and having the settings of Radbots in most rooms 2 (17°C) with 3 in the living room (19°C), lower in the hall, seems to have saved substantial space heat demand cf last November. HDD12=141 vs 101 last November. |
| 2019-12 | 179 (5.8/d) | -58 (-1.9/d) | 493 (16/d) | 20191130T18:17Z to 20191231T18:17Z (31d) | Meter readings: electricity generation 58.4kWh, export 11.3kWh, import 131.4kWh (thus net consumption (I+G-E) 178.5kWh, self consumption ((N-I)/N) 26%); gas ~44.4m^3 (so 493kWh @ 11.1kWh/m^3). SunnyBeam needed restart on 31st, losing last day's detailed readings, and requiring scrabbling around for last few daily values! HDD12=153 vs 128 last December. |
| 2019 total (Jan–Dec) | 1992 (5.46/d) | -3855 (-10.6/d) | 3157 (8.65/d) | 20191231T18:02Z to 20191231T18:17Z (365d) | HDD (913 vs 989) means a little less heat demand, reflected in gas use. We're in Ofgem's 2020 'low' (25% percentile) gross electricity consumption band (in bottom 10% for imports at 914kWh, self-consumption ~54%, and net exporting), and half the 'low'/25% value (8MWh) for gas (about in the bottom 5% by meter). Our space heat gas demand is ~2.2MWh/y or ~30kWh/m^2/y (twice Passive House), at room target temperatures in November/December of 17°C to 19°C. Note that grid electricity carbon intensity dropped significantly again in 2019, which would reduce the benefit of our electricity exports, but previous (0.43kgCO2/kWh) figures will be used for comparison for now. This may be subject to revision and restatement, especially now that live intensities are available for 2020 onwards. |
| kgCO2 | 857kg (2.3/d) | -1658kg (-4.5/d) | 600kg (1.6/d) | ~-0.20tCO2 (~-0.55kgCO2/d) gas/electricity emissions total for 4 people, based on 0.43kgCO2/kWh for electricity (netted) and 0.19kgCO2/kWh for gas, ie slightly carbon negative. We did not fly this year and still do not own a car. | |