Earth Notes: Statscast - PV Up, Travel Down, Weakly Weeklies (2020-04)
Updated 2026-01-26.Statscast for April 2020
Hi, I'm Damon Hart-Davis, and welcome to Earth Notes podcast on all things eco and green and efficient @Home!
Turn-of-the-month update of home energy and related stats at 16WW (ie EOU Towers) for April: 'leccy consumption, generation and import, gas for hot water, mains water temperature. And other significant GB/Europe/world numbers over the month-ish. A spot of audification too...Maybe not all the numbers have to be directly 'eco' related to hold interest. Here is this episode's mystery number: 33821. Don't sue me.
If you have been especially thorough in absorbing the minutiea of the host EOU (earth dot org dot UK) Web site, especially the footers of the full-fat desktop pages, you may already know what this ordinal is. Knowing might be evidence of you needing to get out more, but under lockdown that's forgivable. Beans will be spilt later in this episode...
Here's a mystery noise to ponder too [...]
[01:22]Data
There are many interesting anecdata to pick from for April, homegrown and beyond!
A non-numeric anecdatum first... When my aunt was asked by her local paper what effect covid-19 was having on her farm, she said that the weather had been more of a nuisance, being first too wet and then very quickly too dry, badly checking Spring growth of grass. Later, she said, there will be shortages of feed, seeds, fresh vegetables, etc, as ancillary businesses go under.
Look at my Saving Electricity and Gas (2020) page for most of the detailed energy numbers that I'll talk about next.
Gross electricity consumption at 16WW, that is everything used by appliances and gadgets, ignoring all generation and battery activity, is higher than I'd like. A typical value is 5 to 6kWh/day at this time of year. But for the last four months it's been around 7kWh/day. The first two months were likely largely bumped up by dehumidifier use, and March and April were higher as a result of extra Xbox and cooking workouts from us all being at home all the time for some of March and all of April.
However, the lockdown has resulted in less air pollution and thus apparently more blue skies. Our mains water has been warm and April's PV generation a record on our grid-tied system (18kWh/day against a more typical 15).
The Met Office says it has probably been the sunniest April on record, and the solar power industry reported its highest ever production of electricity (9.68GW) in the UK at 12:30 on Monday 20 April.
Being home to be able to chose the optimum time to run loads such as the dishwasher, and being able to run my laptop off-grid more easily, has improved self consumption from 69% last April to 77% this, with imports staying under 2kWh/day. On occasion imports are well under 1kWh/day. Both the grid-tied and off-grid systems are almost making it through the night without emptying. Each has done it about once in the last month.
Dinner time is still tricky and forces imports in the usual [GB grid] 4pm to 7pm weekday peak slot. However, under lockdown, the actual peak seems to have slipped back a bit, and we [16WW] are in any case typically importing ahead of the old 6pm-ish time.
We can sneak the roughly 2kW peak demands of the washing machine and dishwasher under the PV generation curve on a sunny day, avoiding imports. But the kettle at 3kW, and cooking in the morning and evening, particularly if the (2kW) oven is used [too], are beyond the Enphase to cover.
From lockdown right now, but with rising clean energy supply and continuing likely lower demand, there is an interesting though anticipated issue. National Grid warns that Britain could be at risk of blackouts on Friday from renewables over-supply into very low demand. Essentially, there needs to be a clearer legal right for the grid operator to turn off renewable energy that can't be used. This is not a bug, it's a feature. I hope that we will over-build renewables massively so that we can usually turn some off, and then very rarely don't have enough. This minimises the need for storage (likely to stay relatively expensive) or even fossil-fuel backup.
Pollution has dropped significantly because of reduced travel, quite likely cars being a large large part.
I have relatives in Rome and Paris, and the Citymapper Mobility Index (% of city moving compared to usual) for 1st May is showing Rome at 3%, Paris at 4% and London at 9%. At the other end of the scale are Seoul at 45% and Hong Kong at 51%.
An email I received from TfL (Transport for London) on the 30th, as a regular user of its services in normal times, said in part:
The number of people using Tube and rail services has fallen dramatically by around 95% and the number of people using buses by around 85%. This is important to stop the spread of coronavirus.In a piece also on the 30th by Heidi Alexander, the London Mayor's deputy for transport and deputy chair of Transport for London, she said:
... on Easter Sunday we recorded the lowest level of Tube journeys in a single day since the 19th century ...
... How will social distancing be observed on the Tube? ... each carriage could carry just ... a sixth of normal rush hour loading. ... normal planning assumptions for the Tube are that four people occupy each square metre.
We also got an interesting glimpse into the massively inflated demand for some (not all) products from retailers during panic buying. Sainsbury's CEO Mike Coupe told the BBC that sales growth peaked at 48% in the week to 21 March, and said:
We sold more, for five days running, than we would normally sell in our busiest day at Christmas, that's why you saw the gaps on the shelf.
... [we have seen] a very marked change in the way our customers are shopping.
They're coming less frequently and are buying about twice as much when they do come.
Some facts and figures that caught my attention!
[06:35]Audification
Here's what the mystery noise from earlier is about...
Audification is the process of turning numbers into sounds to help understand them, in the same way that visualisation turns numbers into images such as graphs.
Starting from the episode Battery Sounds: How Does a Battery Sound in Time-lapse? my target is to find weekly (that is, 7-day) signals in my energy data. Why? Because I want to see if our consumption patterns are mainly daily, with relatively little change for weekends. Under lockdown such a barely-weekly finding might be less astonishing, but my thesis is that our life is driven most strongly by a constant daily cycle anyway. Other households may well be very different.
One slight issue with 'hearing' a weekly cycle if I find one, is that at the typical 1-year to 1-second timelapse that I have been using until now, the cycle would be a touch over 52Hz. That's only a little higher than, and might be confused with, UK mains hum. I can hear 52Hz in my headphones but not on my MacBook Air speakers, so I might have to crank speed up a bit, maybe to three years per second, to ensure that all listeners can hear it. But then I feel a bit short of data, at not even two full years captured with the Enphase battery system so far!

Listening again to some previously captured PV generation timelapse from just over a year in duration [...] the seasonal fluctuation is quite audible [again ...], and in a plotted spectrogram a strong daily signal is also clear at about 365Hz, and is much of the 'buzz' [again ...]. Sunshine does not know about human weeks (though there may be more rain at weekends due to changing pollution levels) so a strong weekly signal would be unexpected.
I failed to find a weekly signal in battery discharge, but rediscovered the high-pitched whistle of the fridge/freezer consumption! [...]

I saw a hint of something like weekly in the spectrogram of grid imports, and there's an audibly quieter summer when demand is covered by PV. [...] But it really is only a hint (a relatively low peak), and at about 104Hz, so twice per week, which is puzzling. This is the mystery noise from earlier!
So then I had the brain wave to look at gross electricity consumption as well. (That's backing out the effect of the battery and PV; what we actually use.) There's a couple of small quiet bits for August holidays, but otherwise is fairly constant, and a fainter twice-weekly 104Hz part. [...]
This quest is not finished yet, therefore; finding a good weekly cycle, and making it audible, eludes me. No cut to the chase for this episode!
(See more audification details in the show notes).
Bonus sound: the intro and outro sound is a new audification of five years' worth of solar PV generation data from EOU Towers via the SunnyBeam display unit. Again, more in the show notes.
[09:43]Mystery number
Now for the mystery number reveal!
As I come towards the end of putting together this episode it now stands at: 34034.
What is this mysterious value, that has risen by 213 since I started this piece on the ?
It's the revision number for the SVN repository in which I keep all the source files, and many of the data files, for this and some related sites. Each increment represents the capture of one or more changed files. Most of those changes are manual, but some are (for example) the new daily consumption values for the grid-tied and off-grid PV systems.
Quite a few of those 213 commits are edits and contributions to this piece, including the words and the sounds, and even the code to make those sounds!
I said not to sue!
There's more on my "Earth Notes" Web site at
Earth.Org.UK.
Show Notes
The signature sound 5YPV is derived from 5 years of PV generation. See further notes on its construction'
Audification details
Listening to this YouTube video suggests that if I want any weekly component to be heard at all in non-optimal conditions (eg laptop speakers rather than headphones) then I should get it well over ~100Hz, maybe at least 140Hz. That implies two or three years per second as a minimum. Which means I feel a bit short of data (less than two years from Enphase)!
This useful embedded YouTube video suggests that the combination of my MacBook Air speakers and my ears don't register much outside the range 100Hz to 13kHz; with my Jabra Evolve 40 headphones maybe cleanly from 40Hz to 14kHz. Someone else reports that with my speakers + sub, about 30--15000[Hz], which is around where my hearing cuts out I think.
I suspect that I should also avoid close multiples of 50Hz (or 60Hz) mains hum
Note that 60Hz to 250Hz is still 'bass'.
Revisiting electrical stats sounds of PV generation as recorded by the Enphase with 15-minute sampling, then N/R (.wav):
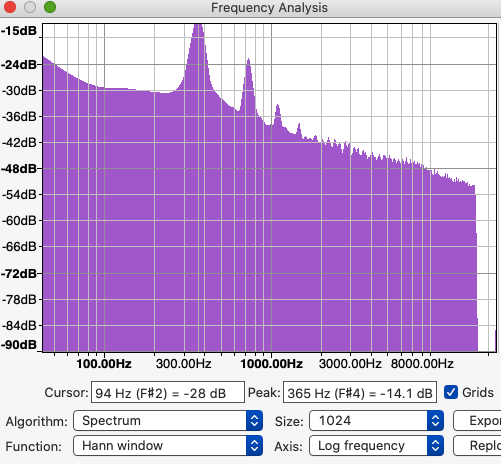
Looking at Audacity's spectrum analysis shows the daily peak clearly at 365Hz, with three or four distinct harmonics, presumably simply there because the generation curve is not a plain sine wave. No weekly pattern would be expected, and nor is one seen.
Battery discharging with 15-minute sampling, then N/R (.wav):

There is some hope in seeing a weekly pattern in the pattern of, for example, battery discharge, reflecting different patterns of consumption during weekdays and weekends. That would be a signal at ~52Hz. Possibly because two of us work from home much of the week, hay nada! Maybe there are a few more harmonics of the 365Hz peak because this signal is much less smooth than the PV generation.
There is an interesting final peak about about 10.6kHz, or ~29 times per day! I think that's probably the fridge/freezer demand, since the cycle time is about right. It is maybe particularly audible in shoulder months as not covered by PV generation directly most of the day, but there is juice in the battery to cover the demand.
Imports from the grid to the house are recorded and available from Enphase at 15-minute resolution. I tweaked the script to select which parameter to audify. FIELD set to 5 for imports.
cat data/16WWHiRes/Enphase/adhoc/net_energy_20*.csv.gz | gzip -d | sh script/mkaudio/Enphase15mFlowsToWAV.sh > ~/tmp/imp.wav

Grid imports with 15-minute sampling, then Normalized and resampled on the fly for MP3 files (.wav):
This is not dominated by a daily cycle (at 360Hz) but has a first small peak at ~104Hz (twice weekly) then 242Hz (~5 times per week) then 360Hz (weekly), 481Hz (1.3 times per day), then big peaks at 724Hz/1087Hz/1820Hz ie 2/3/5 times per day.
The spectrogram gives no indication of phase, for example, but using Additive synthesise waveform generator (with +H2 sin, -H3 sin, +H5 cos) I can get something that looks like a plausible reconstruction of our daily import curve with breakfast and evening peaks. Note that we also do have a common very early demand in the small hours running the dishwasher overnight.

Gross consumption (excluding battery and PV) with 15-minute sampling, then Normalized and resampled on the fly for MP3 files (.wav):
Only the faintest hint of any cycle longer than a day (at ~100Hz, twice-weekly again). The main peaks are at 1/3/5 cycles per day. Lots of action centred on ~10.6kHz again, presumed from the fridge/freezer.
The quiet bits near the start and just over half-way through are August holidays with basically only the fridge/freezer chewing electricity.
So this time around the quest for the weekly cycle is unfulfilled!